Outline
2. The importance of aid in SSA; the variations in aid flows
3. A key theoretical issue: the relationship aid-growth
4. The debates on aid dependency and its negative effects
6. There have been many proposals of reform
1. Defining aid
See for data the OECD Development Assistance Committee (DAC) annual reports, the Development Cooperation Reports.
The literature on aid is huge. Among many others, see Tarp 2000. Foreign Aid.'
- There are various sources of aid:
Aid may be provided by multilateral agencies, e.g. the IFIs or regional institutions, such as the EU, very active in SSA, and by bilateral sources.
The main donors are members of the OECD's Development Assistance Committee (DAC). DAC members = 23 members (22 until recently) (most European states, Japan, the US, Australia, New Zealand, Switzerland).
Some countries prefer to use the multilateral channel – i.e. WB, EC, UN, regional banks, others -, other countries prefer to use the bilateral channel= e.g., Italy, Greece, less the UK or the Netherlands.
- Official financial flows=net disbursements by official sources to a recipient country.
See the last DAC Development Cooperation Report, technical notes (last chapter of the DAC Report )
DISBURSEMENT: The release of funds to – or the purchase of goods or services for – a recipient; by extension, the amount thus spent. Disbursements record the actual international transfer of financial resources, or of goods or services valued at the cost to the donor. In the case of activities carried out in donor countries, such as training, administration or public awareness programmes, disbursement is taken to have occurred when the funds have been transferred to the service provider or the recipient. They may be recorded gross (the total amount disbursed over a given accounting period) or net (the gross amount less any repayments of LOAN principal or recoveries on GRANTS received during the same period).
- ODA (Official Development Assistance) = loans administered with the objective of promoting the economic development and welfare of developing countries.
See the DAC Development Cooperation Report, technical notes
AID: The words "aid" and "assistance" refer only to flows which qualify as OFFICIAL DEVELOPMENT ASSISTANCE (ODA).
ODA has to be distinguished from the 'Other Official Flows', bilateral and multilateral
ODA has to be distinguished from 'Private Flows' (i.e., direct investment, international bank lending, bond lending, other private, private export credits, securities of multilateral agencies, bilateral portfolio investment).
Technical definitions: see the technical Notes-Glossary (last chapter of the DAC Development Cooperation Report
OFFICIAL DEVELOPMENT ASSISTANCE (ODA): GRANTS or LOANS to countries and territories on the DAC List of ODA Recipients and multilateral agencies that are undertaken by the official sector at concessional terms (i.e. with a GRANT ELEMENT of at least 25%) and that have the promotion of the economic development and welfare of developing countries as their main objective. In addition to financial flows, TECHNICAL CO-OPERATION is included in aid. Grants, loans and credits for military purposes are excluded.
OFFICIAL DEVELOPMENT FINANCE (ODF): Used in measuring the inflow of resources to recipient countries: includes: a) bilateral ODA; b) GRANTS and concessional and nonconcessional development lending by multilateral financial institutions; and c) those OTHER OFFICIAL FLOWS which are considered developmental (including refinancing LOANS) but which have too low a GRANT ELEMENT to qualify as ODA.
- Recipients of ODA.
See the DAC List of aid recipients (DAC report, OECD website)
Before 2005:
Part I: Developing Countries and Territories (Official Development Assistance)
=LDCs + Other Low-Income Countries (per capita GNI < $745 in 2001) +Lower Middle-Income Countries (per capita GNI $746-$2975 in 2001) +Upper Middle-Income Countries (per capita GNI $2976-$9205 in 2001) + High-Income Countries (per capita GNI > $9206 in 2001)
Part II: Countries and Territories in Transition (Official Aid) = Central and Eastern European Countries and New Independent States of the former Soviet Union +More Advanced Developing Countries and Territories
BUT: aid to more advanced developing and transition countries declined as they became more prosperous, with several former Soviet bloc states joining the European Union and becoming donors themselves.
In 2005, the DAC therefore decided to revert to a single List of ODA Recipients, abolishing Part II.
DAC LIST OF ODA RECIPIENTS: For statistical purposes, the DAC uses a List of ODA Recipients which it revises every 3 years. The List is presented in the following categories:
● LDCs: Least Developed Countries. Group established by the United Nations. To be classified as an LDC, countries must fall below thresholds established for income, economic diversification and social development. The DAC List is updated immediately to reflect any change in the LDC group.
● Other LICs: Other Low-Income Countries. Includes all non-LDC countries with per capita GNI USD 935 or less in 2007 (World Bank Atlas basis).
● LMICs: Lower Middle-Income Countries, i.e. with GNI per capita (Atlas basis) between USD 936 and USD 3705 in 2007.
● UMICs: Upper Middle-Income Countries, i.e. with GNI per capita (Atlas basis) between USD 3706 and USD 11455 in 2007.
See www.oecd.org/dac/stats/daclist. In September 2008, the Development Assistance Committee approved the List of Recipients of Official Development Assistance (ODA). It will govern ODA reporting for three years, starting with 2009 reporting of 2008 flows.
The DAC List is reviewed every 3 years. Countries are divided into income groups based on Gross National Income (GNI) per capita as reported by the World Bank, with the Least Developed Countries (LDCs), as defined by the United Nations, separately identified. Countries that have exceeded the high-income threshold for three consecutive years at the time of the review are removed from the List.

- Terms and conditions of aid: see definitions in the OECD-DAC Report
- Aid may be tied or untied.
TIED AID: Official GRANTS or LOANS where procurement of the goods or services involved is limited to the donor country or to a group of countries which does not include substantially all aid recipient countries. Tied aid loans, credits and ASSOCIATED FINANCING packages are subject to certain disciplines concerning their CONCESSIONALITY LEVELS, the countries to which they may be directed, and their developmental relevance so as to avoid using aid funds on projects that would be commercially viable with market finance, and to ensure that recipient countries receive good value.
UNTIED AID: Official Development Assistance for which the associated goods and services may be fully and freely procured in substantially all countries.
Most aid to the least development countries is now untied by agreement and some donors have untied all their aid.
- Grants and loans: most donors now have grant-only programmes, though some larger donors continue to provide loans, e.g., for infrastructure projects.
- Concessional vs. non-concessional loans. See OECD-DAC definitions in the DAC Glossary (OECD DAC website)
Concessional loans= a grant element of 25% or more. Non-concessional loans= have a grant element of less than 25%. The grant element reflects the financial terms of a transaction: interest rate, maturity (interval to final repayment) and grace period (interval to the first repayment of capital).
In many donor countries, the share of grants in bilateral ODA is close to 100%.
See technical notes, DAC reports
GRANTS: Transfers made in cash, goods or services for which no repayment is required.
LOANS: Transfers for which repayment is required. Only loans with MATURITIES of over one year are included in DAC statistics. The data record actual flows throughout the lifetime of the loans, not the grant equivalent of the loans (cf. GRANT ELEMENT). Data on net loan flows include deductions for repayments of principal (but not payment of interest) on earlier loans. This means that when a loan has been fully repaid, its effect on total NET FLOWS over the life of the loan is zero.
Bilateral grant=transfer of money for which no payment is required; see WB, WDI
Bilateral loan= loan having a grant element of at least 25% (calculated at a rate of discount of 10%).
Technical definitions: see the DAC report
GRANT ELEMENT: Reflects the financial terms of a COMMITMENT: interest rate, MATURITY and grace period (interval to first repayment of capital). It measures the concessionality of a LOAN, expressed as the percentage by which the present value of the expected stream of repayments falls short of the repayments that would have been generated at a given reference rate of interest. The reference rate is 10% in DAC statistics. This rate was selected as a proxy for the marginal efficiency of domestic investment, i.e. as an indication of the opportunity cost to the donor of making the funds available. Thus, the grant element is nil for a loan carrying an interest rate of 10%; it is 100% for a GRANT; and it lies between these two limits for a loan at less than 10% interest. If the face value of a loan is multiplied by its grant element, the result is referred to as the grant equivalent of that loan (cf. CONCESSIONALITY LEVEL). (Note: in classifying receipts, the grant element concept is not applied to the operations of the multilateral development banks. Instead, these are classified as concessional if they include a subsidy ("soft window" operations) and non-concessional if they are unsubsidised ("hard window" operations).
CONCESSIONALITY LEVEL: A measure of the "softness" of a credit reflecting the benefit to the borrower compared to a LOAN at market rate (cf. GRANT ELEMENT). Technically, it is calculated as the difference between the nominal value of a TIED AID credit and the present value of the debt service as of the date of DISBURSEMENT, calculated at a discount rate applicable to the currency of the transaction and expressed as a percentage of the nominal value.
- Composition of ODA. Official Development Assistance/ODA=
1. Bilateral grants and grant-like flows, of which:
+technical cooperation
+ developmental food aid
+ emergency and distress relief
+ debt forgiveness
+ administrative costs
2. Bilateral loans
3. Contributions to multilateral institutions, of which: UN, EC, IDA, Regional Development Banks
E.g., project assistance vs. programme assistance. Currently, criticism of project assistance and focus on programme assistance, i.e. non-earmarked to specific projects, e.g. budget support.
See Mark Sundberg and Alan Gelb. 2006. Making Aid Work, Finance and Development, December, vol. 43, n° 4. People typically think of aid as financing for development. But a large amount of aid is not intended for this purpose. OECD countries count a wide range of financing items as ODA, including such special-purpose items as costs linked to program administration, emergency and food assistance, technical cooperation, and debt relief. What remain are "non-special-purpose grants" that constitute what taxpayers typically consider foreign aid: financing for education, infrastructure, and health projects, as well as budget support for general financing needs. Over time, this share of aid going to project and program support has fallen. In per capita terms, the decline in project and program aid during the 1990s was significant, and it has not yet recovered.
Many factors have contributed to reducing the share of aid that finances development projects. The decline by more than one-third in the share of program and project aid in total ODA—from 63 percent to 41 percent—has coincided with increases in the share of administrative costs, debt relief, and emergency aid (see Chart 3).
Technical cooperation, much of it spent on foreign advisors, has historically been the second largest component of aid—even though finance for training programs, analytic reports, and expert advice may never actually cross the borders of the donor country. Its share has declined but is still about one-fifth of total ODA, valued at $4.5 billion to Africa in 2004.

Administrative costs on bilateral aid have increased from an average of 5 percent to nearly 8 percent of assistance, in part because of the proliferation of agencies and countries involved in delivering aid—whereas 2 agencies and 10 countries provided aid to Africa in 1960, these numbers had increased to 16 agencies and 31 countries reporting to the DAC by 2004. Measures of donors' administrative costs do not take into account the enormous administrative burden placed on the countries that receive aid. One informal estimate based on a survey of high-level policymakers suggested that as much as half of senior bureaucrats' time in African countries is taken up in dealing with requirements of the aid system and visiting bilateral and multilateral delegations (World Bank, 2000).
Debt relief has increased fivefold since the late 1980s and today makes up 20 percent of all ODA. It is recorded as a special-purpose grant in the OECD-DAC system, which reflects the intent to make most debt relief additional to new ODA commitments. Valuing debt relief is quite difficult and warrants further work to improve measurement. But relief on liabilities that are not being (and often cannot be) serviced does not provide a new flow of resources for development, although it does reduce debt overhang. That said, relief for debt that is being serviced and clearly constitutes a claim on future resources may provide a future dollar-for-dollar cash-flow equivalent.
Emergency and food aid has also increased significantly, nearly doubling from 7 percent to 13 percent of total ODA since 1980. This type of aid is helpful in a crisis but does not generally contribute to financing long-term development.
2. The importance of aid in SSA; the variations in aid flows
- For all but the richer developing countries, aid has been the major source of external finance since the 1970s.
Comparing 1991–95 with 1970–75, for low-income countries on average, aid as a share of GDP increased from 6 to almost 15%, while private capital inflows (including FDI) fell from 2 to 1 % of GDP. See Morrissey, 2004. Conditionality and Aid Effectiveness Re-evaluated.
See Mark Sundberg and Alan Gelb Making Aid Work, Finance and Development, December 2006, vol. 43, n° 4. Aid as a key source of financing in SSA, though FDI have increased.

- The reflection on aid ineffectiveness is linked with the notion of 'aid fatigue'
Since the 1990s, aid fatigue, for the aid agencies and public opinions, which explains the decline of aid.
See Easterly 2001, FT, see Easterly 2001. The Elusive Quest for Growth: $1,000 billion spent since the 1960s, bilateral donors and the BWIS. Failure of objects associated with prosperity in the industrialised world - dams, roads, schools, and fads: institutional democracy, constitutions, independent judiciaries, decentralisation.
In the 1980s and 1990s, the IFIs made 958 conditional loans; during the 1990s, they gave 10 or more conditional loans each to 36 poor countries, even if for Easterly, government mismanagement continued.
For Easterly, the growth rate of income per person of the typical member of this group during the past two decades was zero. The conditions on the loans were not enforced.
Multilateral lenders are responsible, with resisted conditionality: multilateral and bilateral agencies had incentives to continue lending even when recipient government do not implement policy supposed to improve growth. Donors gave aid and loans only because the function of donors and multilateral agencies is to give aid and loans.
Conditional debt forgiveness package=sign that the previous conditional loans had not worked.
Aid donors' interest in 'overselling solutions': multitude of things for development, complementary: equal rights and law, contract enforcement, stable politics, accountability of public officials, low corruption, trust between market participants and so on.
For a review, see Doucouliagos and Paldam. 2005. The Aid Effectiveness Literature: The Sad Results of 40 Years of Research.
- Assessments depend on the time span
See Gupta, Pattillo, and Wagh (2006), Are Donor Countries Giving More or Less Aid?: the volume of aid has increased during the last 4 decades, with interruptions in certain years. Over time, the major recipients have changed: the share of aid to Asia has diminished since the 1980s, aid to SSA has grown.
Since the late 1990s, debt relief has assumed a larger share of the increased aid flows to SSA. The share of technical cooperation—a component of aid that is viewed as being driven by donors—has risen.
Recent increased emphasis on providing budget support to recipient governments, especially in the form of debt relief. But problems of donor harmonisation, national ownership
For the IMF: 'sound policies' of recipients are crucial for aid to be effective.
- Aid in SSA has been falling, but this fall must be compared with historically high levels in the early 1990s.
For some studies, aid or 'resource intensity' is not unusually high given the structural characteristics of SSA countries.
But it rose more rapidly than predicted until the mid-1990s. What is important is the level of management costs accompanying aid, which are higher in SSA (see O'Connell and Soludo 2001, Aid intensity in Africa)
- Movements of official aid flows over the last decade
See IMF, Regional Economic Outlook: Sub-Saharan Africa, October 2008.


See the special issue of Finance and Development, September 2005, vol. 42, n°3, 'Aiding Development': interesting even if now a bit obsolete
= in the 1990s, declining aid volume: the decline seems to have ended in the 2000s. Following two decades of relative stability.
A partial explanation of the movements of aid flows: aid flows were diverted to transition economies, 'trouble spots'.
Continuing an existing trend, multilateral agencies represent a growing share of total aid, in part as a result of the expansion of EU aid, but non-EU donors have contributed more of their aid through the UN system: see White 2002, Long-run trends and recent developments in official assistance.
Significant variations in aid flows: Recent increase in aid at the global level. But uncertainties about its duration: specific factors, such as particular events and debt relief. Signs of a decrease starting in 2006…
OECD-DAC reports: the aid 'boom' in 2005-06 is primarily due to debt relief for Iraq and Nigeria and emergency aid to the Indian Ocean Tsunami hit countries. In 2007, the large debt relief operations are complete.
From Jeremy Clift, Scaling up aid: Where's the New Aid Money?, IMF Survey online, July 20, 2007

See OECD-DAC website, November 2008. Aid targets slipping out of reach? Overview. Aid continued to increase in 2007, once exceptional debt relief is excluded from the figures. But the increase was only 2% on 2006. This is much too slow if donors are to meet their commitments to increase aid by 2010.
The current financial crisis will increase pressure on donor aid budgets. Total ODA in 2007
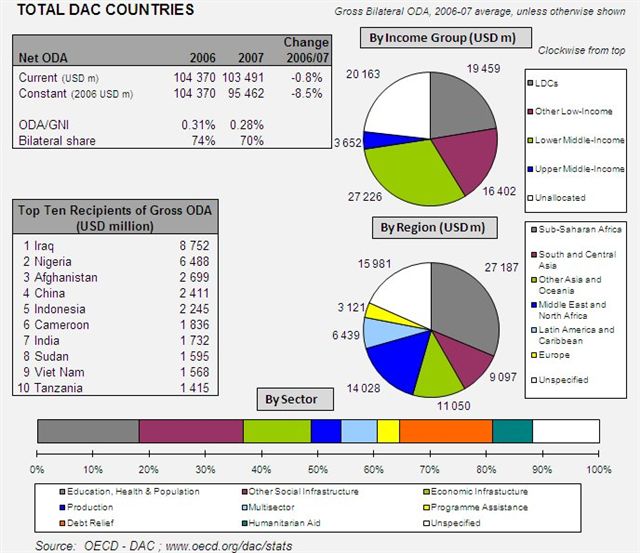
Final data from members of the Development Assistance Committee (DAC) show that total net official development assistance (ODA) was USD 103.5 billion in 2007. This represents a drop from 0.31% of their combined gross national income in 2006 to 0.28% in 2007, or a fall of 8.5% in real terms.
ODA had been exceptionally high in 2005 (USD 107.1 billion) and 2006 (USD 104.4 billion), due to large Paris Club debt relief operations for Iraq and Nigeria. Debt relief diminished in 2007 to USD 9 billion as the Paris Club operations tapered off.
Excluding debt relief grants, DAC members' net ODA rose slightly by 2%. This is a truer reflection of the underlying trend in aid flows.
Figure 1 shows the impact of debt relief on net ODA in 2005 and 2006. It also shows a small increase in humanitarian aid in 2005 as special assistance was provided in the wake of the Indian Ocean tsunami and earthquake in Pakistan. Bilateral development projects and programmes dipped slightly in 2006 but are on the rise again in 2007, indicating that donors are gradually scaling up their core aid programmes.

See OECD-DAC Reports, web statistics: debt relief varies from year to year. Belgian and French debt relief to the Congo pushed debt relief to 30% of their ODA. Portuguese relief to Angola took debt relief to over half its ODA in 2004.

Department of Economic and Social Affairs Division, Trends in Sustainable Development: Africa Report, UN, New York 2008
At the Millennium Summit, developed countries also agreed to roughly double ODA flows to Africa in 2010 compared to 2000. A substantial part of the increase in aid flows in the most recent years has come from debt relief.
- Geographical distribution of ODA
Department of Economic and Social Affairs Division, Trends in Sustainable Development: Africa Report, UN, New York 2008

When calculated on a per capita basis or compared to countries' national incomes, ODA receipts vary widely across SSA countries. Between 2001 and 2005, net ODA receipts for SSA (including regional aid) represented about 4% of GNI, or slightly under US$ 31 per capita.
ODA receipts have represented more than 30% of GNI in countries recovering from wars: Burundi, the Democratic Republic of the Congo, Eritrea, Liberia and Sierra Leone. By contrast, ODA flows have represented less than 1% of national income in countries such as South Africa, Mauritius, Gabon, Côte d'Ivoire and Botswana.
Small countries get far more aid per person than larger countries. Some fragile states are among the most aided. See DAC Reports, Statistical Annex:
The top 10 recipients in volume vary from year to year. Large countries feature regularly: e.g., reconstruction in Iraq, DRC/Congo, because of debt relief, Nigeria, China, Indonesia.
See OECD-DAC website, November 2008. Aid targets slipping out of reach?
ODA Flows by Recipient. The largest recipient of net bilateral ODA in 2007 was Iraq, which received USD 9 billion, of which USD 4.8 billion were net debt forgiveness grants. Afghanistan was the next largest recipient receiving USD 3 billion, followed by Tanzania (USD 1.8 billion), Cameroon and Sudan (USD 1.7 billion each).
Aid is increasingly poverty-focussed. Total net ODA to the Least Developed Countries (LDCs) has nearly doubled in real terms over the last 10 years, to reach USD 32.5 billion in 2007, representing about a third of total aid (see Annex A, Chart 2).
Africa. In 2007, net ODA to Africa amounted to USD 38.7 billion, representing 37% of total aid. This corresponds to a fall of 18% in real terms, mostly due to exceptional debt relief especially for Nigeria in 2006. If debt relief grants are excluded, then ODA to Africa rose by 12% in real terms.
Net ODA to SSA was USD 34.2 billion, of which USD 21.5 billion was bilateral aid from DAC donors. In 2007, debt relief grants returned to their levels prior to 2005. Excluding debt relief grants, aid to the region increased by 11% in 2007.

www.oecd.org/dac/stats/donorcharts.

From the DAC Report 2008
- Which sectors?
See the special issue in Finance and Development 2005 (IMF-WB online)

- Differences among donors and over time
See OECD-DAC website, November 2008. Aid targets slipping out of reach?
The largest donors in 2007, by volume, were the United States, followed by Germany, France, the United Kingdom and Japan. Five countries exceeded the United Nations target of 0.7% of GNI: Denmark, Luxembourg, the Netherlands, Norway and Sweden (see Annex A, Table 1 and Chart 1).
In 2007, net ODA by the United States was USD 21.8 billion, representing a fall of 9.8 % in real terms. Its ODA/GNI ratio fell to 0.16%. This fall was mostly due to debt relief, which was high in 2006, and a reduction in ODA to Iraq. Excluding debt relief grants, there was an increase in ODA to sub-Saharan Africa (+6.5% in real terms to USD 4.5 billion) and the Least Developed Countries (+4% to USD 4.8 billion). ODA to Afghanistan increased (+5% to USD 1.5 billion) and remained important to Iraq despite a fall in real terms (-24% to USD 3.7 billion).
Japan's net ODA was USD 7.7 billion, representing 0.17% of GNI. The 29.8% fall in real terms was in part due to a decrease in debt relief operations, which were exceptionally high in 2005 and 2006, and to a decrease in contributions to international financial institutions. Japan's ODA has been on a downward trend since 2000, except for an increase in 2005 and 2006 due to debt relief.
The combined ODA of the fifteen members of the DAC that are EU members – which represents nearly 60% of all DAC ODA - fell by 6.6% in real terms to USD 61.5 billion, representing 0.39% of their combined GNI. Again, the fall was mainly due to a decrease in debt relief grants. Excluding these, net ODA from DAC EU members rose by 7.7%.


- Another measure: see the Center for Global Development/Foreign Policy 'Commitment to Development Index'.
See the index of donor performance built by Roodman 2004 (2006 edition: working paper 67)
Aid: the top countries are Sweden, Denmark, the Netherlands, Norway, and the US the worst performer: at the bottom, Japan, Canada, etc. (see the CDG website)
Only 4 donors (Denmark, Netherlands, Norway, Sweden) met the UN target of at least 0.7% of GDP as aid' in the last two decades.
Other donors: low levels of generosity, the US=the lowest=0.14% of GDP over the 1990s (see Round and Odedokun 2003). DAC data: in 2004, Italy and the US at the lowest.
3. A key Theoretical issue: the relationship aid-growth
- A key debate: the relationship between aid and growth
For the history and economics of aid, conditionality, dependence, see the review of the literature in Hansen and Tarp. 2000. Aid effectiveness disputed.
See the review of Tarp 2006. Aid and Development: retrospective look at how foreign aid has evolved since World War II in response to a dramatically changing global political and economic context. + whether aid has been effective in furthering growth.
See Riddell, 2007. Does Foreign Aid Really Work?
A key question: the Lucas paradox (1990): why doesn't capital flow from rich to poor countries?
For neoclassical theory, capital should flow in this way: assumptions of same goods, constant returns to scale production, same factors of production; if capital were allowed to flow freely, returns on investment in any location should be the same
Various explanations of the 'paradox' =international capital markets imperfections (asymmetries of information), or differences in production structures?
- Inconclusive literature on aid and economic growth in the 1960s, 1970s and 1980s:
See e.g. Boone 1996 Politics and the Effectiveness of Foreign Aid: aid financing more consumption than growth.
Many doubts on the existence of a relationship: see Hansen and Tarp. 2001. Aid and growth regressions
- What could be the links between aid and growth?
Historically, a series of well-known different models: aid as a way of 'closing the gaps'
See Hjertholm, Laursen and White. 2000, Macroeconomic Issues in Foreign Aid, University of Copenhagen.
See White 1998 Aid and Macroeconomic Performance)
- The 'two-gap' model: savings gap, trade gap (or foreign exchange gap)
Model of Chenery and Strout 1966: the two-gap model=link between investment and growth, and determinants of investment being domestic and foreign savings.
The first gap is between the amount of investment necessary to attain a certain rate of growth and the available domestic saving
+the second gap is the one between import requirements for a given level of production and foreign exchange earnings; foreign aid fills one gap
Harrod-Domar model tradition: in developing countries=capital shortageàaid fosters growth by enabling the country to finance more rapid accumulation of capital, supplementing private savings; the effectiveness of aid depends on the productivity of capital (the ICOR); a sustainable growth path may generate a financing gap filled through aid or other forms of financing.
Assumption of a stable linear relationship between investment and growth over the short to medium run (from a Leontief production function with fixed requirements for capital and labour per unit of output).
Many criticisms: e.g., on the link investment-growth (constant capital-output ratio).
Now Harrod-Domar model marginalised by the neo-classical growth model and by endogenous growth theory= modest role of physical capital investment, education and R&D as determinants of growth+ criticism of the relationship foreign aid- investment (issue of fungibility)
- The Solow growth model:
=possibility of substitution capital-labour: an economy approaches a steady state (rate of population growth+rate of technological change) in which savings are balanced by the need for investment to maintain a constant capital-labour ratio given labour force growth and productivity increases.
- Endogenous growth models in the 1980s:
They emerged because the H-D and Solow models did not explain the persistence of international differences in per capita incomes and growth rates:
Growth here explained by increasing returns to scale, human capital accumulation and positive externalities (learning by doing), path-dependent equilibrium: aid may influence growth when contributing to add to human capital: focus on education, health, institutions as influencing total factor productivity.
Empirical evidence: aid seems to be associated to growth – savings.
But in successful countries (e.g. Asia): limited role of aid.
- Channels of transmission in the relationship between aid and growth? The importance of investment
See Gomanee, Girma and Morrissey. 2005. Aid and Growth in Sub-Saharan Africa: Accounting for Transmission Mechanisms. How does aid affect growth? Investment = the most significant transmission mechanism.
Total effect of aid on growth, accounting for the effect via investment? Pooled panel results for a sample of 25 SSA countries over 1970-1997 = significant positive effect of foreign aid on growth.
On average, each 1 percentage point increase in the aid/GNP ratio contributes 1/4 of one percentage point to the growth rate. SSA poor growth record should not therefore be attributed to aid ineffectiveness.
- For some economists, and most UN agencies, aid is a key factor of growth and poverty reduction
See the 2005 UN report by J Sachs, Investing in Development. For Jeffrey Sachs: with additional aid, i.e. $50 billion per year, the MDGs would be achieved; doubling the share of GDP of rich countries on development aid would bring about a substantial reduction in poverty and disease
='scaling up' of programmes: share of the national income of the aid donors would rise from 0.23 % in 2002, to 0.44 % next year and 0.54 % by 2015àlarge increases in aid from the US and Japan
+for many low-income recipients, aid would reach 20-30 % of national income and finance 2/3 of public spending
But scepticism regarding this arguments for a 'big push': there is an agreement on the goals but there are doubts on the means.
Among the well-known criticisms: see the studies by William Easterly, e.g. Easterly (2006), The White Man's Burden: Why the West's Efforts to Aid the Rest Have Done So Much Ill and So Little Good: Issue of misuse of aid, corruption.
- An important issue: aid may effective and well-devised, but external circumstances may change
See Financial Times, Africa aid wiped out by rising cost of oil, December 28 2007: The rising cost of oil has wiped out the benefits many African countries were expecting from western aid and debt relief over the past three years, new research from the International Energy Agency has shown. The situation is raising fears that, in spite of the strong growth many African countries have seen in recent years, there could be a repeat of the 1980s' debt crisis in the developing world that was caused in part by the oil shocks of the 1970s.
- Another dimension of the debate on the relationship aid-growth: is aid effective?
The key issue of aid effectiveness.
See the review in Nissanke, 2008. Reconstituting the Aid Effectiveness Debate, forthcoming, WIDER.
From the 1990s onwards: intense debates on the poor effectiveness of aid. Aid effectiveness: aid is positively related to growth.
For a discussion of aid effectiveness, and the reasons underlying the ambiguous results, see Bourguignon and Sundberg. 2007. Aid Effectiveness: Opening the Black Box. Problem of causality, difficulty of attribution: impossible to say how many children are inoculated or crops taken to market due to a dollar of aid.
3 types of links:

- Position of the IFIs? For the WB, aid is effective in the presence of 'good policies'.
The debates around the paper by Burnside and Dollar (1997/2000) and the WB report on aid by David Dollar and Lant Pritchett. 1998. Assessing Aid: What Works, What Doesn't, and Why: aid raises growth in a good policy environment.
See Burnside and Dollar. 1997. Aid, Policies, and Growth: panel growth regressions for 56 developing countries and 6 four-year periods (1970-93): policies that have a large effect on growth = fiscal surplus, inflation, and trade openness.
An index of these 3 policies + interacting it with foreign aidàaid has a positive impact on growth in countries with good fiscal, monetary, and trade policies.
In the presence of poor policies, aid has no positive effect on growth.
The Burnside-Dollar paper has had an important influence in the policy-making circlesàjustifying the selectivity of aid: aid to be given to governments which 'merit' aid and implement 'good polices.
Concept of aid selectivity: also the argument of a follow-up WB study by Paul Collier and David Dollar on aid effectiveness in terms of poverty reduction.
Prescriptive approach: aid allocation is optimal in countries with high levels of poverty, low per capita incomes and sound policy regimes.
Countries with unsound policies receive less aid in the Collier–Dollar selectivity approach, as these regimes lessen aid's impact on growth and thus poverty. See Collier and Dollar 2002, Aid Allocation and Poverty Reduction.
Burnside and Dollar confirmed their results in a paper published later: see Burnside and Dollar 2004 Aid, Policies, and Growth: Revisiting the Evidence: in the 1990s allocation of aid to low-income countries favoured ones with better institutional quality: selectivity shows that aid is more productive in 'sound institutional and policy environments'.
This line of research by the WB: aid is effective in promoting growth and, by implication, in poverty reduction.
For the aid agencies, the culprits are the recipient governments that resisted reforms
See the WB report by Dollar, Holmgren and Devarajan. 2001 Aid and Reform in Africa.
See Dollar and Easterly 1999, Aid, investment, and politics in Africa: the traditional aid-to-investment-to growth linkages are not robust, especially in SSA. Aid does not necessarily finance investment and investment does not necessarily promote growth.
Differences in economic policy explain much of the difference in growth performances. Domestic politics rather than aid or conditionality has been the main determinant of policy reform. The combination of good policies and aid has created a productive environment for private investment and growth.
The WB highlights aid fungibility: aid is an incentive for recipient governments to reduce their tax efforts.
Increasing focus on selectivity from the 1990s onwards: before a lesser importance given to the 'quality of governance', see Dollar and Levin 2004 The Increasing Selectivity of Foreign Aid: same group of multilateral and bilateral aid agencies that are very policy focused and very poverty focused: e.g., WB IDA, IMF ESAF, Denmark, the UK, Norway, Ireland, the Netherlands - France and the US not selective.
See Claessens, Cassimon and Van Campenhout. 2007. Empirical Evidence on the New International Aid Architecture: on the bilateral aid allocation of 22 donors among 147 recipient countries over the 1970– 2004 period: changes in the international aid architecture at the international and country level
Question: changes in behaviour? Late 1990s: bilateral aid responds more to economic need and the quality of a recipient country's policy and institutional environment and less to debt, size, and colonial linkages. When a country uses a PRSP and passes the HIPC decision point the perverse effect of large bilateral and multilateral debt shares on aid flows is reduced, suggesting less defensive lending. International aid architecture changes have led to more selectivity in aid allocations, with large differences among donors in selectivity relating to donors' own institutional environments.


- Many criticisms of the Burnside-Dollar theses
E.g. methodological criticisms: see Antipin and Mavrotas. 2006. On the Empirics of Aid and Growth: critique of the aid-policies-growth nexus in Burnside and Dollar: 'Aid, Policies and Growth'; 3 datasets and Bayesian instrumental variable methods to test the robustness of the central finding of the Burnside and Dollar paper related to the aid and policy interaction coefficient.
= the marginal effect of the disputed (Aid/GDP) x Policy variable on real per capita GDP growth is substantially smaller than in Burnside and Dollar èserious doubts on the robustness of their findings, and on the validity of their policy lessons.
Many criticisms of the links aid-good policies-growth
For some studies, in the Burnside/Dollar analysis, when particular variables are added, the coefficient on the interaction between aid and policy becomes near-zero and/or statistically insignificant.
Criticisms even from economists close to the World Bank.
Different results if different definitions of 'policies', 'growth', 'aid'.
See Easterly 2003, Can Foreign Aid Buy Growth?: empirical literature on the links aid/growth: lack of a clear theoretical model by which aid would influence growth: no relationship aid/growth.

See Easterly, Levine, Roodman 2003. New Data, New Doubts: Revisiting 'Aid, Policies and Growth': when new data are included, no robustness of the Burnside Dollar findings, i.e. if updated data from 1970–93 to 1970–97.
See Roodman 2003 on the anarchy of numbers: regressions aid/growth exhibit weak robustness
Relation aid/growth: critics focus on the statistical significance of a quadratic term:
1) aid works in a good policy environment (aid×policy=the key term; policy=an index of several variables);
2) aid works best in countries with difficult economic environments, characterised by volatile terms of trade, low population, and/or other factors (key term=aid×environment or aid×shock);
3) aid works in all environments, but with diminishing returns (aid2=a key term along with aid).
Updated in David Roodman The Anarchy of Numbers: Aid, Development, and Cross-Country Empirics, May 2007 Center for Global Development Working Paper No. 32: many stories of how aid affects growth: aid raises growth in countries with good policies, or in countries with difficult economic environments, or mainly outside the tropics, or on average with diminishing returns. The diversity of these results suggests that many are fragile. I test 7 important aid-growth papers for robustness. The 14 tests are minimally arbitrary, deriving mainly from differences among the studies themselves.
Importance of potentially arbitrary specification choices while minimizing arbitrariness in testing choices. All of the results appear fragile, especially to sample expansion.
A key problem in assessing causalities: the methodologies utilised.
Ssee Roodman, David. 2008. Through the Looking-Glass, and What OLS Found There: On Growth, Foreign Aid, and Reverse Causality 01/07/2008: the cross-country literature on foreign aid effectiveness has relied on the use of instruments to distinguish causality from mere correlation.
For Roodman: non-instrumental techniques demonstrate that the main aid-growth connection is a negative causal relationship from growth to aid—aid, that is, as a fraction of recipient GDP. Coarsely, when GDP goes up, aid/GDP goes down: endogeneity of aid.
See Roodman, David. 2007. Macro Aid Effectiveness Research: A Guide for the Perplexed, 12/10/2007: the quantitative approach to exploring grand questions about aid effectiveness, which began 40 years ago, is probably worth pursuing somewhat further. But the literature will probably continue to disappoint. Perhaps the biggest challenge is going beyond documenting correlations to demonstrating causation—not just that aid went hand-in-hand with growth, but caused it. Given the limited and noisy data available, the effects of aid on growth in particular probably cannot be detected.
The WB 'Assessing Aid' Report has many weaknesses: growth regressions not robust, different results can be obtained with relatively minor variations in model specification. The argument that aid only works when policies are right=not supported in other studies+WB evidence: "policies work better when supported by aid inflows". Which policies are good policies? Problematic choice: the report ignores the likely presence of threshold effects and other non-linearities; others would propose different sets of right policies (e.g. if the focus is poverty reduction rather than growth: see Lensink and White. 2000. Assessing Aid.
- Non-linearities in the aid-growth relationship?
Possible existence of an aid Laffer curve, and possible negative returns: see Lensink and White 2001 Are There Negative Returns to Aid: benefits of aid increase with the initial inflows, but decline after a certain level.
See for a critique of Lensink and White 2001, see the IMF study by Nkusu 2004 Are There Negative Returns to Aid? A Comment.
Threshold effects, diminishing returns of aid? See Gomanee, Girma and Morrissey 2003 Searching for Aid Threshold Effects: aid is effective and contributes to growth beyond a critical level (2% of GNP). There is no evidence of diminishing returns to aid.
Aid most effective when the level is high in countries with relatively low levels of human capital→aid is more effective in countries at lower levels of development.
What are the appropriate levels of aid? Debates not only on the qualitative aspects of aid effectiveness (e.g. fungibility). But the quantitative aspects, e.g. the level of aid requirements, as important element of aid effectiveness
See Kourtellos, Tan and Zhang. 2007. Is the Relationship Between Aid and Economic Growth Nonlinear?. The debates on the role of aid in promoting development use cross-country analyses. Cross-country regression assuming linear relationship between aid and growth and without taking into heterogeneity of countries produce biased estimates.
=> they investigate the relationship between aid and growth using recently developed sample splitting methods that allow to simultaneously uncover evidence for the existence of heterogeneity and nonlinearity.
Findings: no evidence to suggest that the relationship between aid and growth is nonlinear: the partial effect of aid on growth is likely to be weakly negative.
Aid is potentially counterproductive to growth with outcomes not meeting the expectations of donors.
However due to the data comparability problem and inherent econometric problem in cross-country regression, more detailed country case studies are needed to evaluate the impact of aid at the country level and even project level. This can really answer the question that under what conditions what type of aid helped growth and poverty reduction in developing countries.

- The IMF has recently questioned the relationship aid–growth
Here some difference with the WB…..
See Rajan and Subramanian. 2005. Aid and Growth: What Does the Cross-Country Evidence Really Show?: cross sectional and panel data= little robust evidence of a positive (or negative) relationship between aid inflows into a country and its economic growth.
No evidence that aid works better in better policy or geographical environments, or that certain forms of aid work better than others. For the IMF: the aid apparatus will have to be rethought…
See Rajan and Subramanian. 2005. What Undermines Aid's Impact on Growth?: Why no robust effect of aid on the long-term growth of poor countries, even those with good policies?
=aid inflows have systematic adverse effects on a country's competitiveness, as reflected in a decline in the share of labour intensive and tradable industries in the manufacturing sector. These effects stem from the real exchange rate overvaluation caused by aid inflows.
By contrast, private-to-private flows like remittances do not seem to create these adverse effects.
- For a general discussion of the 'pros' and 'cons' regarding aid, see the review of the literature by McGillivray et al. 2005. 50 Years of Controversy over the Macroeconomic Impact of Development Aid
=50 years of research on the macroeconomic impact of aid. Studies until the late 1990s produced either contradictory or inconclusive results. Aid either worked, or it did not.
Major shift in the literature=the release of the World Bank's report Assessing Aid. Research published since that report agrees with its general finding that aid works, to the extent that in its absence growth would be lower => this report: intense debate over the context in which aid works, i.e. whether the effectiveness of aid inflows depends on the policy regime of recipient countries.
- The relationship aid-growth may be contingent on several factors in addition to the quality of recipient country policies, i.e. political stability, democracy, post conflict reconstruction, economic vulnerability.
See McGillivray, 2003, Aid Effectiveness and Selectivity: Integrating Multiple Objectives into Aid Allocations.
E.g., the relationship aid-growth depends on political conditions: see Chauvet and Guillaumont 2002, Aid and Growth Revisited: Policy, Economic Vulnerability and Political Instability.
=they assess the Burnside-Dollar model, where aid effectiveness depends only on policy= policy itself depends on aidàso necessity of a dynamic formulation.
Aid effectiveness positively depends on structural economic vulnerability
+it depends negatively on political instability.
Estimation on 5-year sub-periods from 1975 to 1999 for 53 developing countries: 'efficient' allocation of aid must consider not only the quality of the present policy, but also its potential improvement, the economic vulnerability faced by the recipient country (more aid needed), and its political instability as well (aid less productive).
The relationship aid-growth depend on several variables and channels: see Bigsten, 2006. Aid and Economic Development in Africa: for a review of growth determinants and growth constraints in SSA and how aid can help relieve the constraints: i.e. depend on choice of aid modalities, donor coordination, conditionality, and international integration.
= Aid should be organised not to overburden the recipient system and to provide incentives for policy makers to perform.
- The impact of aid on poverty?: see Mourmouras and Rangazas. 2006. Foreign Aid Policy and Sources of Poverty: a Quantitative Framework. Econometric literature unable to establish a robust association between aid and growth and poverty reduction.
=>Aid effectiveness must be assessed using methods that go beyond cross-country regressions: dynamic general equilibrium model; it quantifies three sources of poverty: (i) lack of access to international capital
(ii) low schooling and high fertility (a poverty trap)
(iii) antigrowth domestic fiscal policy.
Different policies address each source of poverty: aid cost of implementing the different policies? The policies differ dramatically in the extent and timing of their growth effects, and in the aid cost of their implementation.
- Aid may be effective in other domains than income:
See Fielding, McGillivray, and Torres. 2006. A Wider Approach to Aid Effectiveness: Correlated Impacts on Health, Wealth, Fertility and Education: Rather than focussing on per capita income, aid impacts on a range of human development indicators, health, education and fertility: aid has a substantial positive impact.
- Policies or institutions? Policy failure or institutional failure? 'poor governance' may be a determinant of aid ineffectiveness
The importance of the right diagnosis for assessing the determinants of aid ineffectiveness.
Current shift from policy to institutional conditionality= donors' objective=not only temporary policy changes but institutional building. But policy failures and capital shortages linked to institutional failures= poor institutions produce policy failures that in turn produce capital shortages.
See Adam and O'Connell 1999 Aid, Taxation and Development in SSA: donors, view a conflict of interest between government and the private sector and private investment → focus on taxation and distortions, volatile taxation in SSA. Tax can reduce both the level and productivity of domestic investment.
The composition of domestic investment is more important in explaining poor SSA growth than the level of domestic investment.
Policy-generated uncertainty + politicians discretion about policy + patronage distorted taxation favours politically powerful groups=negative effects on growth→governments trade off growth for transfers to the favoured group: here conditional aid is ineffective in spurring investment.
Conditionality is effective when conflict of interest between donors and recipient governments. If donors bargaining position, conditionality of a reduction in distortionary taxes= lost revenues=cuts in politically motivated transfers. But conditionality difficult to enforce and subject to aid dependency.
To avoid aid dependencyàconditionality that shifts the 'no aid' point.
· What types of capital flows are the most beneficial?
The debates on trade vs. aid. I.e. trade preferences/aid flows as alternative forms of donor assistance
See Adam and O'Connell, 2004, Aid versus Trade Revisited: if learning-by-doing externalities in recipient country export productionà(non) equivalence between trade preferences and aid.
Dynamic CGE model: shows that switching donor support on the margin from aid to trade preferences increases recipient country welfare.
- The debates on the appropriate type of aid
Many types of aid: technical assistance, food aid, aid to imports, counterpart funds, project aid, programme aid, and so on
àdebate on their respective or negative effects+ their effectiveness on the fiscal management of the recipient country.
In context of aid heterogeneity, government responds differently according to the nature of the aid inflows.
In SSA= mostly IDA concessional lending: concessional IDA credits conditioned on, e.g., primary health, education…
Very controversial issues: e.g., debates on food aid harmful for agricultural producers, or budget aid breeding corruption, or project aid ending in useless 'white elephants', and so on.
Types of aid flows have to be distinguished for assessing the relationship between aid and growth. See Clemens, Radelet and Bhavnani, 2004, Counting Chickens when they Hatch: The short term effect of aid on growth.
= 3 categories: (1) emergency and humanitarian aid (likely to be negatively correlated with growth); (2) aid that affects growth over a long period of time, e.g. aid to support democracy, the environment, health, or education (likely to have no relationship to growth over four years); (3) short impact aid: aid stimulating growth in 4 years: budget and balance of payments support, investments in infrastructure, aid for productive sectors (agriculture and industry)
à a positive, causal relationship between this 3rd type of aid and economic growth (with diminishing returns) over a four-year period.
See Mavrotas and Ouattara. 2003. Aid Disaggregation, Endogenous Aid and the Public Sector in Aid-Recipient Economies: Evidence from Côte d'Ivoire: different categories of foreign aid inflows: project aid, programme aid, technical assistance and food aid. The government responds differently according to the nature of the aid inflows.
For those interested, see Bazoumana Ouattara (2007), Foreign Aid, Public Savings Displacement and Aid Dependency in Côte d'Ivoire: An Aid Disaggregation Approach, Oxford Development Studies, vol. 35, n°1, March, pp. 33-46= fiscal response framework: which categories of aid flows, i.e., project aid, programme aid, technical assistance and food aid, displace public savings and affect the recipient country's dependence on aid.
Time series data for Côte d'Ivoire, period 1975-99: project aid flows reduce public savings and worsen Côte d'Ivoire's dependence on aid more than the other categories of aid flows. Hence importance of considering aid heterogeneity.
E.g., food aid is often criticised for its negative effects, e.g. harming local agricultural producers.
For an unexpected result, see Levinsohn and McMillan. 2005. Does Food Aid Harm the Poor? Household Evidence from Ethiopia: household-level data, Ethiopia. Findings = food aid in Ethiopia is "pro-poor".
(i) net buyers of wheat are poorer than net sellers of wheat; (ii) there are more buyers of wheat than sellers of wheat at all levels of income, (iii) the proportion of net sellers is increasing in living standards; (iv) net benefit ratios are higher for poorer households indicating that poorer households benefit proportionately more from a drop in the price of wheat
Households at all levels of income benefit from food aid and the benefits go disproportionately to the poorest households.
- The debate on the effectiveness of grants vs loans?
For a theoretical assessment of the link aid–debt, see Nissanke and Ferrarini. 2006. Assessing the Aid Allocation and Debt Sustainability Framework, WIDER.
Mix between loans and grants, the degree of concessionality of loans?
Economic and political factors influenced donors' grant-loan mix. Loans are better suited than grants in promoting recipient governments' budgetary discipline. The rate of official borrowing by the recipients (extent of their past debt burden) is positively influenced by the extent of the concessionality of such loans (subsidized interest rates or longer grace periods). Grants, soft loans and non-concessional loans=respective comparative advantage. Negative incentive problems of soft loans (see Odedokun 2003).
It is an important controversy: see the Center for Global Development website: the 2005 meeting on the respective benefits of grants vs loans?
See Cohen, Jacquet and Reisen, 2005, Beyond Grants versus Loans: How to use ODA and debt for development: market failures justify ODA. A priori no overall superiority of grants as compared to loans. Loans may be a superior solution, if they focus on debt sustainability.
The IMF is also aware of the differential impact of grants vs loans: see Mourmouras and Mayer 2004, The Political Economy of Conditional and Unconditional Foreign Assistance: Grants versus Loans: one-time grants more effective than loans rollovers when assistance is unconditional – and the opposite when assistance is conditional.
A debate that developed in 2005 (and was put on the WB website): for the WB: grants rather than loans in the poorest countries (goal of US administration)? Many other wealthy countries have resisted the idea of handing out WB funds with no requirement to repay: fears that such a move would undermine the WB financial strength. For the US official, no sense to lend additional money to impoverished and indebted countries =the International Development Association/IDA would increase its grants to nearly 30% of total assistance over the next 3 years.
Arguments of those who criticise grants: the WB loans given to the poorest countries are already provided on very easy terms, with no interest= the shift doesn't help recipient countries: IDA loans =highly concessional, 40 years to repay, with 10 years of no payments, and a 0.75 % annual "service fee" =loans on a very long-term basis.
Vs. the pro-grants arguments: in very poor countries such as in SSA, many projects do not generate resources (e.g., health projects) quickly to repay debt.
4. The debates on aid dependency and its negative effects
Aid dependency, vicious circles, aid traps…
For a broad political economy perspective, see Van de Walle 2005. Overcoming Stagnation in Aid-Dependent Countries
· Some SSA countries are excessively dependent on aid, e.g., for budgets, investment, maintenance, infrastructure, health, education
On aid dependence in SSA and the response of savings, see UNCTAD 2000, Capital flows and growth in Africa.
SSA dependency on aid is high.
Aid = 28 $ per capita in 2002 or 6.3% of GNI (to be compared with 4.5% in 1997); 34 $ per capita and 6% of GNI in 2003; 36 $ per capita and 5.3% of GNI in 2004; 44 $ per capita and 5.5% of GNI in 2005; 52$ per capita and 6% of GNI in 2006 (see WB WDI 2004-2008)
Aid = in 2002, 32.2% of gross capital formation, 29.5% in 2003, 26.1 in 2004; 27.3% in 2005; 27.1% (to compare with 24.5% in 1997).
Some extreme cases: in 1997, in Congo, aid= 30.8% of central government expenditures (in 2002, 10.5%); in DRC, in 2003, aid = 99.9% of GNI. In 2004, Sierra Leone, aid = 34.3% of GNI, in 2005, 29.6%. In Liberia, aid=53.4% of GNI; in Burundi, aid= 54.6% of GNI.
In Senegal, in 2002, aid =41% of central government expenditure (in 1997, 50.5%); in Uganda, aid=65.5%. In Mozambique in 2002, aid close to 58% of GDP; 25% of GNI in 2003; aid =85.7% of gross capital formation in 2003. In Burundi in 2005, aid =46.8% of GNI.
Some countries exhibit low dependency ratios, e.g., Nigeria, Botswana, South Africa: less than 1% of GNI.
But SSA countries are not the worst cases: e.g., Haiti: in 1997, aid= 93.4% of central government expenditure; in Nicaragua in 2002, 84.9%; in Kyrgyz republic, 70%.
- The WB is aware of the negative effects of aid dependence
See Elbadawi 1999 on aid as an hindrance to export orientation: in SSA dependence on foreign aid substantially impairs export competitiveness and export-oriented development strategies
Relationship between ODA, real exchange rates (RER) and non-traditional exports=unsustainable ODA caused substantial partial RER overvaluation in SSA and non SSA. Exceptionally high aid-dependent SSA countries have experienced RER overvaluation.
Conditional on absence of RER overvaluation - a proxy for good policy environment, Laffer curve-type relationship between aid and non-traditional exports through the misalignment of RER relative to its equilibrium.
The Laffer curve relationship→concept of aid dependency: the extent to which excessive ODA flows exceeds the threshold beyond which more ODA hinders export expansion.
- The IMF is aware of the problems caused by aid dependence, even more than the WB
See Rajan and Subramanian 2005. What Undermines Aid's Impact on Growth?: aid may lead to the mismanagement of the real exchange rate, which affects the manufacturing sector.
Rajan and Subramanian 2005 Aid and Growth: What Does the Cross-Country Evidence Really Show?. little robust evidence of a positive (or negative) relationship between aid inflows into a country and its growth.
No evidence that aid works better in better policy or geographical environments, or that certain forms of aid work better than others.
This is related to the much debated issue of the current goals of the international donor community of the scaling-up of aid
See The Macroeconomics of Managing Increased Aid Inflows: Experiences of Low-Income Countries and Policy Implications, IMF, 2005: it highlights the problems of absorption of aid; distinction between saving aid, absorption and spending of aid.
Other key IMF policy documents: IMF, Fiscal Policy Response to Scaled-Up Aid, Fiscal Affairs Department, June 5, 2007. IMF, Fiscal Policy Response to Scaled-Up Aid: Macro-Fiscal and Expenditure Policy Challenges, Fiscal Affairs Department, June 5, 2007. IMF, Aid Inflows: The Role of the Fund and Operational Issues for Program Design. Background Paper, Policy Development and Review Department, June 14, 2007. IMF, Aid Inflows: The Role of the Fund and Operational Issues for Program Design, Policy Development and Review Department, June 14, 2007.
For a critical review of these issues, see UNCTAD. 2006. Economic Development in Africa: Doubling Aid: Making the "Big Push" Work.
A key debate: how to manage aid surges (e.g., the promises of donors towards SSA, e.g. the G8 summit at Gleneagles): the problems of the absorption and spending of aid
See Bourguignon and Sundberg. 2006. Absorptive Capacity and Achieving the MDGs. The ability of LICs to absorb large amounts of aid is a central issue for the scaling-up of aid. On absorptive capacity
Example of Ethiopia and the role of infrastructure, skilled labour, macroeconomic, and other constraints on absorptive capacity.
= careful sequencing of public investment across sectors minimise the costs of reaching the MDGs; the macro impact of large aid flows on the tradables sector can be serious in the short run; large-scale frontloading of aid disbursements can be costly as it pushes against absorptive constraints; improvement of governance and institutional structures can reduce the cost of achieving the MDGs.
Aid surges: especially in 5 SSA countries: Ethiopia, Ghana, Mozambique, Tanzania, and Uganda— often from already high levels.
See Finance and Development, September 2005. Absorption has to be distinguished from spending


See the IMF-IEO 2007: Spending and Absorbing Additional Aid. Cf the "spend and absorb" terminology in "The Macroeconomics of Managing Increased Aid Inflows—Experiences of Low-Income Countries and Policy Implications." The latter was a background paper for the Board's 2005 PRGF review. Focusing on five countries with aid increases during 1998–2003—Ethiopia, Ghana, Mozambique, Tanzania, and Uganda—it compared how much was "absorbed" (as measured by changes in the current account deficit) with how much was "spent" (as measured by changes in the fiscal deficit).
Indeed, a key IMF study is the evaluation of IMF intervention by the IMF evaluation office: International Monetary Fund-Independent Evaluation Office. 2007. The IMF and Aid to Sub-Saharan Africa.
Its main findings: - PRGFmacroeconomic policies have accommodated the use of incremental aid in countries whose recent policies have led to high stocks of reserves and low inflation; in other countries additional aid was programmed to be saved to increase reserves or to retire domestic debt.
- PRGFs have neither set ambitious aid targets nor identified additional aid opportunities—where absorptive capacity exceeds projected aid inflows.
- PRGF fiscal governance has been far more systematically treated than other elements, such as the use of social impact analysis or the pro-poor and progrowth budget provisions.
Cf the IMF's 2005 "spend and absorb" framework: questions= (1) how much of increased aid was programmed to be absorbed (in higher net imports);
(2) how much of increased aid was programmed to be spent (in higher net public expenditures)?
(3) how PRGFs analysed aid absorptive capacity
(4) PRGF programmes "adjusters": whether and how much of aid surprises could be spent and absorbed.

See Aiyar, Shekhar and Ummul Ruthbah. 2008. Where Did All the Aid Go?: on the macroeconomic usage of aid using panel data for a broad sample of aid recipients.
By definition an increase in aid must go toward a reduction in the current account balance (absorbed aid), an increase in capital outflows, or reserve accumulation. It is found that short-run absorption is typically very low, with much aid exiting through the capital account.
Moreover, aid spending, defined in terms of the increase in government fiscal expenditures as a result of aid, is significantly greater than aid absorption, implying that aid systematically leads to an injection of domestic liquidity in recipient economies.
This illuminate the rather weak link between aid and growth in the literature. It reinforces the case for greater coordination between fiscal and monetary authorities in response to aid inflows.

- Negative effects of aid on fiscal management.
The'fiscal response models'
The issue of aid fungibility. Fiscal response: aggregate fungibility.
Fiscal behaviour of governments receiving aid: aid affects government expenditure because aid recipients have other objectives that differ from those of donors →concept of aid fungibility.
A key debate: the possible crowding out effects of aid for savings, the negative effects on budget discipline?
Aid as an incentive for capital flight: see Paul Collier studies on capital flight, 37% of the wealth of SSA in 1990 (but questionable method…)
See Hjertholm, Laursen and White. 2000, macroeconomic issues in foreign aid: 2 lines of reflection on aid fungibility
1) regarding government spending patterns
2) 'fiscal response' literature, more theoretical=how aid impacts on various categories of expenditures and financing sources (e.g. taxes).
Fungibility of aid in SSA?
For those interested, see Devarajan, Rajkumar and Swaroop 1999 What Does Aid to Africa Finance?: policy research working paper 2092: aid partially fungible in SSA. Every dollar of aid leads to a 90 cent increase in government spending. Aid's effect on the composition of current and capital spending? They increase equally. SSA fungibility of loans to specific sectors mirrors patterns found in a broader sample of countries.
Aid to energy, transport, and communication sectors increases public spending in those sectors not one for one (vs. worldwide sample, aid to transport and communications is almost fully non-fungible). Aid to the education sector has no effect on education spending in the global sample: almost one-for-one effect on education spending in SSA.
SSA governments do not spend all sectoral aid in that sector-nor do they treat sectoral aid as budgetary support. The more donors to a country, the more aid is fungible. If the number of donors represents a proxy for monitoring costs, not surprising that most aid is partly fungible.
Question: is fungibility a concern? Non fungible aid does not work better than fungible aid (see Petersson. 2003. Foreign Aid Fungibility, Growth, Poverty)
- But other studies do not find negative effects of aid on fiscal behaviour and revenue
See Osei, Morrissey and Lloyd (2005), The Fiscal Effects of Aid in Ghana:. Aid is given to the government and thus aid should affect fiscal behaviour. But theory and evidence is ambiguous regarding the nature of these effects.
Dynamic linkages between aid and fiscal aggregates?
34 years, example of Ghana: aid associated with reduced domestic borrowing and increased tax effort, combining to increase in public spending. This constructive use of aid to maintain fiscal balance is evident since the mid-1980s, following Ghana's SAP
= aid associated with improved fiscal performance in Ghana, implying that the aid has been used sensibly (at least in fiscal terms).
- Fiscal impact of aid and 'fiscal response models'
On the case of Ethiopia, see Martins, Pedro M. G. 2007. The Impact of Foreign Aid on Government Spending, Revenue and Domestic Borrowing in Ethiopia.
= Questioning the IMF framework (IMF 2005, Gupta 2005)

See Martins, 2007. The Fiscal Impact of Aid Flows: Evidence from Ethiopia. on the impact of aid on government expenditure, revenue and domestic borrowing. Period 1964-2005.
Findings: foreign aid to Ethiopia has had a positive impact on government capital expenditure, but not a significant effect on recurrent spending (the coefficients are virtually zero).
Moreover, aid loans seem to have had a stronger impact on government expenditure than grants, particularly on capital spending (with a coefficient of 0.30 for loans versus 0.06 for grants). Indeed, aid flows (especially loans) are often earmarked to specific investment projects, while governments are likely to use domestic tax revenues to pay for most recurrent costs.
Interestingly, both aid grants and loans have had a strong negative effect on domestic borrowing: aid and domestic financing are close substitutes.
The results support the hypothesis that aid displaces domestic revenue: negative coefficient for loans (-0.15) but an even larger one for grants (-0.47). This raises concerns about how low-income countries can overcome aid dependence.

On Tanzania: see Li and Rowe. 2007. Aid Inflows and the Real Effective Exchange Rate in Tanzania

Evidence that the policy response to aid inflows helps explain the negative and significant relationship between the REER and net aid inflows over this period. When aid flows into Tanzania the authorities must decide whether it is to be used to finance expenditures or a tax reduction.
Following the IMF (2004) the spending of aid is defined as the widening in the government's fiscal deficit before aid that accompanies the increase in aid.
there has been a steady increase in the amount of net aid financing that is recorded in the budget. This has the effect of showing up as a steady increase in net aid inflows in the fiscal accounts over the entire period 1995- 2005.
Increases in net aid inflows are largely being spent in the economy as increases in net aid inflows are accompanied by a widening of the before aid fiscal deficit.
A strong correlation between net aid inflows and fiscal expenditures is also apparent (Figure 11). This result is consistent with IMF (2004) which found that over 90 percent of incremental aid flowing into Tanzania was spent over the period 2000-05.
· Negative effects of aid on indebtness?
Gap-models: macroeconomic rationale for foreign aid, because insufficient domestic savings, foreign exchange or government revenue => closing the gaps. No distinction/grants, loans and other flows.
But if gaps are closed through debt-creating flows→ problems = the cost difference to the recipient in the form of future repayments → adverse implications for the savings, forex and fiscal gaps.
à2 problems: debt capacity problems, disruption of normal debtor-creditor relations=debtor is unable (or unwilling) to honour debt service (payment arrears accumulation, debt rescheduling)
+ large foreign debt that affects development: see Hjertholm, Laursen and White. 2000. Macroeconomic Issues in Foreign Aid.
· A reaction from the IMF: the debate on maintaining a 'fiscal space'
See Heller, Katz, Debrun, Thomas, Koranchelian and Adenauer. 2006. Making Fiscal Space Happen! Managing Fiscal Policy in a World of Scaled-Up Aid: Debt relief and the scaling up of aid to low-income countries should allow for greater fiscal space for expenditure programmes to create long-term growth: design of a suitable medium-term fiscal framework that fosters a sustainable delivery of better public services and infrastructure while maintaining a credible commitment to fiscal prudence?
What low income countries can do to shape fiscal policy frameworks trying to absorb additional aid while still ensuring longer-term sustainability for government expenditure programmes and finances? (scaled up aid)
- An issue that triggered much debate: the volatility of donors' aid and its negative effects.
Aid volatility has detrimental effects on recipient countries
àanalogy with the windfall gains inducing 'Dutch disease' effects.
The negative effects of aid volatility have been highlighted in particular by the IMF.
See Bulir and Lane 2002 Aid and Fiscal Management: volatility makes difficult the macroeconomic fiscal management in aid-receiving countries, as despite the declining share of aid in budgets of donor countries, aid continues to play an important role. Implications of aid for short-term fiscal policy management: how actual or anticipated changes in aid receipts should be reflected in government spending.
Aid flows are unpredictable, and even more volatile than fiscal revenues, particularly in highly aid-dependent countries.
Aid is mildly procyclical in relation to activity in the recipient countryà aid disbursements are welfare-reducing. Uncertainty about aid disbursements is large: see Bulir and Hamann 2001 How Volatile and Unpredictable Are Aid Flows.
See Bulir and Hamann 2003, Aid Volatility: an Empirical Assessment: volatility and uncertainty of aid flows= a key problem. Aid is more volatile than fiscal revenues, particularly in highly aid-dependent countries. This relative volatility increases with the degree of aid dependency as measured by the aid-to-revenue ratio+ coincidence of shortfalls in aid and in domestic revenue.
+ large uncertainty about aid disbursements
+ very small information content of donors' commitments= commitments by donors consistently exceed disbursementsàaid cannot be predicted reliably on the basis of donors' commitments alone.
See the update of Bulir and Hamann. 2006. Volatility of Development Aid: From the Frying Pan into the Fire?
See Fielding and Mavrotas. 2005. The Volatility of Aid, aid volatility analysed using data for 66 aid recipients over the period 1973-2002; disaggregating total aid inflows into sector and programme aid. The institutional quality of the aid recipient affects the stability of sector aid but not that of programme assistance + more open economies, which tend to be smaller and richer, are associated with more volatile sector aid flows.
See International Monetary Fund. 2005. The IMF's Role in the Determination of the External Resource Envelope in SSA: problems of governance, of managing uncertain flows, of absorptive capacity.
See Kharas. 2008. Measuring the cost of volatility: financial metric: unlike other estimates, this measure does not depend on parameter estimates from cross-country regressions, nor on country-specific model simulations. The costs of volatility rose steadily until 2002, and have since fallen.
Findings: ODA is much more volatile than major macro variables: five times as volatile as GDP and three times as volatile as exports for the average recipient. ODA typically magnifies real business cycles in recipient countries.
The aid system generates massive negative income shocks to some developing countries (on rare occasions). These large negative shocks account for the high cost of volatility. The impact of aid shocks has been as large and as frequent as income shocks faced by developed countries during the two World Wars, the Great Depression and the Spanish Civil War.
Volatility costs between $0.07 and $0.28 per dollar of aid, depending on the donor.
The OECD DAC is aware of these issues:
See OECD, 2008, Scaling Up: Aid Fragmentation, Aid Allocation and Aid Predictability: www.oecd.org/dac/scalingup. Report of 2008 Survey of Aid Allocation Policies and Indicative Forward Spending Plans
The report uses a new measure of the amount of aid that can be programmed at the country level: country programmable aid (CPA). In 2005 – the baseline year for the Survey – CPA was USD 60 billion. Some USD 47 billion of this was from bilateral donors, equal to 46% of their gross bilateral ODA.
The main exclusions are debt relief, humanitarian aid, NGO funding, and administrative, imputed student and in-donor refugee costs. The 33 donors covered by the Survey provided information on forward spending to 2010 that covered 56% of their total CPA. Estimates were made for the balance.

This possible funding gap is illustrated below – the difference between donors' forward projections (solid red line) and required CPA level if all donors fulfil their pledges (dotted red line).

See Oya Celasun and Jan Walliser, Managing Aid Surprises, Finance and Development, September 2008, vol. 45, n°3. Countries cannot make full use of aid when it is unpredictable
Aid is highly unpredictable. According to OECD-DAC data, during 1990-2005, on average, annual aid disbursements in SSA deviated from aid commitments by 3.4% of GDP. Other regions also show deviations of disbursements and commitments in the range of 1.7-2.4% of GDP during 1990-2005. But, contrary to the common belief that donors systematically disburse less aid than they commit, low aid predictability in both data sets is a result of disbursements falling short as well as exceeding expectations and commitments, in particular in SSA. This shows that managing unpredictable aid flows involves both aid shortfalls and windfalls.
Predictability of budget aid is strikingly low even for better-performing recipient countries. In data on IMF-supported programs, budget aid disbursements deviate from projections by about 1% of GDP, which represents about 30 percent of disbursed budget aid, on average (see Chart 1). The degree of predictability varies considerably. For example, Sierra Leone, a postconflict country, received 6% of GDP in budget aid—and 50% of this aid arrived unexpectedly, implying that half of each year's budget aid was either cut or added while the budget was under implementation. By contrast, in Ghana less than 25% of budget aid was unexpected.

Adjusting to shortfalls
By using this IMF-based data set—which covers 13 countries with long-term program relations during 1992-2005—adjustments to budget aid surprises can be broken down into changes in tax revenue, current spending, domestically financed investment spending (total public investment spending minus investment spending funded by project aid), domestic bank financing (financing by the central bank and commercial banks), net debt service, and other categories. The other category mostly reflects nontax-revenue and nonbank-financing items.
How prevalent are budget aid shortfalls? Budget aid disbursements fall short of projections in about 60% of the fiscal years covered in the sample. The average budget aid shortfall is 1.1 % of GDP (see Chart 2, top panel). The management of these aid shortfalls is often made more difficult by simultaneous tax revenue shortfalls (0.3% of GDP) and current expenditure overruns (0.3% of GDP). Recipients therefore typically need to address simultaneously aid shortfalls, tax revenue shortfalls, and current expenditure overruns, amounting to 1.7 % of GDP. They do so largely, in order of magnitude, through higher domestic bank financing (0.7% of GDP), reductions in debt service or increases in arrears (0.4 % of GDP), cuts in domestically financed investment spending (0.3% of GDP), and other financing sources outside regular channels—such as privatization or nontax revenue (0.3% of GDP).

What emerges as a key adjustment pattern for aid shortfalls is a mix of additional domestic financing and cuts in investment spending, while current spending is, on average, higher than projected. The data thus confirm that recipient governments would normally not be able to reduce current spending (mostly salaries) but largely concentrate expenditure adjustments on budgetary investment spending. Governments operating in an environment of uncertain budget aid may restrain their budgetary investment expenditures if they do not receive aid early in the budget cycle. Persistent uncertainty about budget aid disbursements also undercuts simple budget management responses to shortfalls, such as the delay of investment spending from one year to the next.
Structural differences in countries' policy frameworks can result in different adjustment patterns for similar aid shortfalls. For instance, member countries of the West African Economic and Monetary Union (WAEMU), which do not have access to monetary policy instruments and have limited or no ability to borrow from the central bank, had to cut investment spending more deeply than did other countries. On average, WAEMU countries compensated for half of the aid shortfall with a cut in investment spending and financed less than a third of the shortfall through the domestic banking system. Non-WAEMU countries cut investment spending by one-sixth of the aid shortfall, financing three-quarters by borrowing from domestic banks.
Adjusting to windfalls
Additional budget aid finances the repayment of debt or additional government consumption. Higher-than-expected disbursements of budget aid take place about 40% of the time, and average 1 % of GDP for the IMF data set (see Chart 2, bottom panel). On average, none of the excess aid and revenue goes toward additional domestic investment spending. Instead, recipients reduce domestic bank debt (0.9 % of GDP) and increase current expenditure (0.6% of GDP), benefiting from the fact that countries collect more nontax revenues in periods of aid windfalls. Aid windfalls typically come too late in the budget year and thus cannot be spent on items other than current expenditures.
Saving aid windfalls allows building up space for future aid shortfalls and could be part of a strategy to manage unpredictable aid. But, surprisingly, even countries that have received excess aid for several consecutive years appear to use most, if not all, of the extra aid for reducing debt rather than additional expenditure.
With almost identical budget aid and revenue windfalls, WAEMU countries expanded current expenditure by much less (0.4% of GDP) and saved more (0.5 % of GDP) by paying down bank debt as compared with their non-WAEMU counterparts. These policies reflect a larger degree of self-insurance by WAEMU countries, given the tighter domestic borrowing limits faced by governments. In both WAEMU and non-WAEMU countries, little, if any, additional investment spending took place in response to aid windfalls.
Key findings. The analysis shows that lack of predictability hurts investment outlays, which are cut in periods of aid shortfalls but not raised during aid windfalls. By contrast, government consumption rises in response to aid windfalls. This finding is further illustrated by a review of the bilateral relationship between key variables:
• A 1% of GDP aid shortfall is associated with a statistically significant downward adjustment of investment spending of 0.1-0.2% of GDP, whereas investment spending does not rise with aid windfalls.
• Government consumption does not fall during aid shortfalls, but a 1% of GDP aid windfall is associated with a 0.6 percent of GDP rise in consumption.
• Domestic bank financing is used to absorb both aid shortfalls and windfalls, but to a different degree. A 1 % of GDP aid shortfall is associated with additional domestic bank financing of 0.5% of GDP. A 1% of GDP aid windfall is associated with a reduction of domestic financing (domestic debt repayment) that is larger (0.8 % of GDP) than the additional bank financing during aid shortfalls.
- Effects of aid on the exchange rate: risk of appreciation
Dutch disease effects of aid: appreciation of the real exchange rate
See Li and Rowe. 2007. Aid Inflows and the Real Effective Exchange Rate in Tanzania. Tanzania may receive a significant increase in aid inflows.
Despite the potential for the additional aid inflows to raise income levels, increasing them may bring about unwelcome structural changes: i.e. an appreciation of the real exchange rate that leads to a contraction of traditional export sectors and a loss of export competitiveness.
On the relationship between aid inflows and the real effective exchange rate, findings= the long-run behavior of the real effective exchange rate is influenced by terms of trade movements, the government's trade liberalisation efforts, and aid inflows.
Positive terms-of trade movements are associated with an appreciation, periods of improving trade liberalisation are associated with a depreciation, and increases in aid inflows are associated with a depreciation in the real effective exchange rate.
Key conclusion: no evidence that net aid inflows to Tanzania have led to an appreciation of the REER: aid surges are associated with depreciations in the REER both in the short-run and the long-term.


See Adam 2005 Exogenous Inflows and Real Exchange Rates: concerns that large aid inflows will induce an appreciation of the real exchange rate and discourage the expansion of exports, particularly non-traditional exports, thereby damaging growth prospects in the recipient economy = centre of contemporary debates on the macroeconomics of aid to low-income countries.
Aid flows can generate a so-called 'transfer paradox', a situation where a gift may leave the recipient worse off that it was before the transfer.
But there may be positive effects, e.g. when public infrastructure augments the productivity of private factors, and when there is an initial scarcity of public infrastructure, there are potentially large medium-term welfare gains from aid-funded increases in public investment, despite the presence of some short-run Dutch disease effects.
àHence which appropriate policies? Sterilisation? See Prati, Sahay, and Tressel. 2003 Is There a Case for Sterilizing Foreign Aid Inflows?: aid inflows can cause small real exchange rate appreciation.
Does a policy that prevents the real appreciation by sterilising the base money effect of aid improve welfare? real exchange rate measure=black market nominal exchange rates +a country-specific export-weighted commodity price index. A doubling of ODA flows=cause a real appreciation of up to 4% at impact which could increase to about 18% after 5 years.
Sterilisation policy is effective in preventing real appreciation. Monetary policy has permanent effects on real variables and sterilisation increase national savings by leading to an accumulation of international reserves.
Sterilisation increases welfare when aid Dutch disease costs greater than its consumption and productivity benefits+ the economy better off saving part of the aid for later use. But sterilisation reduces welfare when the consumption and productivity benefits of aid are large relative to Dutch disease costs.
See Adam, O'Connell, Buffie, Pattillo. 2007. Monetary Policy Rules for Managing Aid Surges in Africa: on the instruments of monetary policy in order to manage macroeconomic volatility, while still maintaining a commitment to low inflation. For the IMF ("The Macroeconomics of Managing Increased Aid Inflows: Experience of Low- Income Countries and Policy Implications", PDR, August 2005) and Foster and Killick (2006, What would doubling aid do for macroeconomic management in Africa?, ODI, London), this is crucial in the macroeconomic management of volatile aid inflows: concerns with the short-run management of aid inflows may overshadow broader considerations of the medium-term rationale of aid.
In extreme cases, pressures for countries to reduce their reliance on aid, even when the medium-term returns to aid remain high = strategies of active foreign exchange intervention and reserve buffering designed to smooth the path of domestic deficit financing serve best to influence short-run macroeconomic volatility + for pre-stabilisation countries, a managed float, with little or no sterilization of increases in the monetary base, is the best approach.
Question: which alternative monetary policy rules in response to large aid surges in low-income countries characterised by incomplete capital market integration and currency substitution.
Findings: simple monetary rules that stabilise the path of expected future seigniorage for a given aid flow have attractive properties relative to a range of conventional alternatives, e.g., those involving heavy reliance on bond sterilization or a commitment to a pure exchange rate float.

- Does aid crowd out private investment?
If aid represents large positive shocks, e.g., PRSPs, link between official aid flows and private capital flows: see Buffie, Adam, O'Connell, and Pattillo. 2003. Exchange Rate Policy and Management of Official and Private Capital Flows in Africa.
- Aid may undermine institutions and institutional development:
See Azam, Devarajan and O'Connell 1999 Aid Dependence Reconsidered: Aid dependence: short-run benefit from aid, but increasing need for aid, damaging in the long run.
An equilibrium outcome=high-aid/weak-institutions state.
Aid dependence=problems of credibility + incentive effects of aid + moral hazard in the recipient-donor relationship.
Is conditionality efficient? The aid contract is not time-consistent: it explains the poor results of foreign aid + aid induces weak fiscal discipline and increased fiscal difficulties lead to higher inflow of aid: see Svensson 2000 on foreign aid credibility and aid dependence.
See Brautigam and Knack. 2004. Foreign Aid, Institutions and Governance in Sub-Saharan Africa: large amounts of aid and the way it is delivered make it more difficult for good governance to develop, e.g. in some SSA states because of the way aid affects institutions in weak states.
See for an IMF perspective, see Rajan and Subramanian. 2007. Does Aid Affect Governance?, aid may be associated with weak governance, possibly because aid inflows reduce the need for governments to tax the governed or enlist their cooperation.
If the paucity of capital is the missing ingredient of growth, the form in which the capital is received could have adverse spillover effects. Indeed, if foreign aid reduces competitiveness by inflating the exchange rate, or if foreign aid reduces the efficiency of manufacturing investment by adversely affecting governance, and thus contracting, then aid inflows may reduce the profitability of investment and limit growth, especially in export sectors that are the engine of growth.
See Moss, Pettersson and van de Walle (2006), A Review Essay on Aid Dependency and State Building in SSA: An Aid-Institutions Paradox?: substantial increase in foreign aid levels to SSA. There are negative effects of aid dependence on state institutions, on fiscal and state revenue issues + an impact of aid dependence on the relationship between state and citizens.
States which can raise a substantial proportion of their revenues from aid are less accountable, under less pressure to maintain legitimacy, less likely to have the incentives to invest in effective public institutions.
· Aid surges may undermine institutions and fiscal and taxation capacity:
See Moss and Subramanian. 2005. After the Big Push? Fiscal and Institutional Implications of Large Aid Increases: negative influences of large increases on the incentives for institutional development, on the accountability of state institutions to their own populations, and on long-term sustainability.
See Sanjeev Gupta and Shamsuddin Tareq, Mobilizing Revenue, Finance and Development, September 2008, vol. 45, n°3
The case for domestic resources. The average tax-to-GDP ratio in SSA increased from less than 15 % of GDP in 1980 to more than 18 % in 2005. But virtually the entire increase in tax revenue in the region came from natural resource taxes, such as income from production sharing, royalties, and corporate income tax on oil and mining companies. Nonresource-related revenue increased by less than 1% of GDP over 25 years. Even in resource-rich countries, nonresource-related revenue has essentially been stagnant (Keen and Mansour, 2008).
Also, in many of Africa's low-income oil importers, domestic revenue mobilization has not kept pace with rising public spending. As a result, a growing share of current spending is financed by aid. For example, from 1997–99 to 2004–06, the share of current spending financed by aid increased from 16 % to 36% in Ghana, from 22 % to 40% in Tanzania, and from 60% to 70% in Uganda (see Chart 2).

It is not inappropriate for low-income countries to finance a rising share of their recurrent outlays from aid, one might argue. After all, these countries have pressing needs at this stage of their development, and increasing expenditures for infrastructure and human development would only promote growth over time. Although this argument has some merit, policymakers in these countries still need to take into account a number of other considerations.
First, aid-financed projects give rise to additional spending, such as on operations and maintenance, which will need to be covered at least partly, if not wholly, from domestic resources. The country must generate sufficient revenue to finance these expenditures, or the productivity of aid-financed projects and assets will suffer.
- Aid may be viewed as a rent
Aid may have the negative effects of the 'natural resource curse'. See Auty 2007. Aid and Rent-Driven Growth: Mauritania, Kenya and Mozambique Compared: aid as a geopolitical form of rent. Foreign aid shares with natural resource rent and contrived (i.e., government monopoly) rent the property of being a large revenue stream that is detached from the economic activity that generates it, and elicits political contests for its capture.
Rent-driven models suggest such contests have 2 adverse effects: (i) they deflect government incentives into rent-channelling at the expense of promoting wealth creation; (ii) the resulting political allocation of the rent distorts the economy and precipitates a growth collapse.
The 3 causes of aid failure of the literature (corruption, a poor policy environment and Dutch disease effects) are all symptoms of the destabilizing impact of rent streams on immature political economies. Aid that aims at reviving collapsed economies runs the risk of perpetuating rent-seeking and thereby postponing economic restructuring.

- Aid may induce a brain drain of human capital, replaced by costly and often inefficient technical assistance – often supported by loans: worsening effects…Some 40 000 technical assistants residing in SSA at the end of the 1980s, besides thousands of temporary consultants (these figures were provided by a UNDP report by Elliott Berg 1993 on technical assistance)
SSA is said to have lost 30% of its qualified manpower between 1960 et 1987, particularly medical doctors, with obvious effects on public health (see Schiff 2000).
5. Other negative aspects of aid: conditionality, political economy, lack of coordination, fragmentation….
Many debates on the effectiveness of conditional lending
See Morrissey 2004. Conditionality and Aid Effectiveness Re-evaluated: Donors use aid as a lever to encourage policy reform, i.e. conditions are attached to the aid.
The effectiveness of conditionality, the extent to which the reforms advocated by donors are in fact implemented, is mediated by the recipient government's willingness to accept the conditions and its ability to implement them, the latter in turn determined by domestic political and administrative capacity.
In the WB Assessing Aid Report, two arguments: first, that good policy is a prerequisite for aid to be effective and, second, that conditionality is ineffective.
But for Morrissey et al., aid plays an important role in policy not by dictating choice but by informing and supporting the policy process.
- Conditionality as a mechanism that inherently triggers resistance
The 'aid game', the 'ritual dance'= 'exchange of external finance for economic reform', 'buying reform'…
Resistance from governments, interest groups, civil society; policy reversals: key debates on the failure of adjustment and aid.
- Vast literature on these negative effects of the divergences inherent in the mechanisms of conditionality
For those interested, see White and Morrissey 1997 Conditionality When Donor and Recipient Preferences Vary: donor and recipient preferences for policy reform and aid differ.
Conditionality is a bargaining between donors and recipients →cases where donors impose conditions on unwilling recipients + cases where recipients are willing but unable to implement all conditions + situations where recipients and donors are clearly in conflict.
Ex ante conditionality is ineffective in promoting reform and often counter-productive, either inhibiting the reform efforts of sincere governments or undermining its own credibility by encouraging donors to condone slippage.
Power relationships underlie the relations between the IFIs and SSA countries: see Mosley, Harrigan, and Toye 1995. Aid and Power; see Morrissey 2002 Recipient Governments' Willingness.
- Political economy is an essential dimension of aid
It explains many of aid failures.
Conditional loans are a minor factor in politicians' incentives. Problems of conflict over redistribution between groups. Political elites more focused on power than development, and little investment in the people that then may demand a share of power.
Aid lenders gave loans to enable old aid loans to be repaid.
Recipient governments promise the multilateral agencies that this time they would reform (=alcoholics promising never to drink again)
Issue of external aid as an instrument used by rulers for their domestic policy: 'double-edged diplomacy' (as coined by R. Putnam)
See the lecture on IMF programs, e.g., the 'scapegoat' strategy of A. Przeworski.
From Mark Sundberg and Alan Gelb. 2006. Making Aid Work, Finance and Development, December, vol. 43, n° 4

- Aid is a dimension of foreign policy for all countries
Major recipients of aid= for the US Egypt, Israel, Pakistan, Russia. For the UK, the Serbia, India, Afghanistan, Ghana, Tanzania. For France, Morocco, Mozambique, Poland, Côte d'Ivoire, Cameroon…….
In 1998, 20% of ODA was going to the LDCs, 23% to other low-income countries, but more, 31% to middle-income countries (see OECD-DAC statistics)
See Alesina and Dollar. 1998. Who Gives Foreign Aid to Whom and Why?
Corrupt governments receive as much as the less corrupt: see Alesina and Weder. 1999. Do corrupt governments receive less foreign aid?
- Political motives obviously reduce the effectiveness of aid: see Boone 1996 Politics and the Effectiveness of Foreign Aid.
Political motives underlie donors' aid, rather than the needs of developing countries
See Boyce 2002 Unpacking Aid: often oversimplification of analysis of aid, e.g., from 'donors' to 'recipients' countriesà aid has to be 'unpacked'= donor side: aid shaped by economic, political, and institutional objectives of government agencies and their domestic constituents
+recipient side: aid flows not to countries but specific individuals, groups, and classes within them.
See Isopi and Mavrotas. 2006. Aid Allocation and Aid Effectiveness: an Empirical Analysis: Overall, both altruistic and selfish donor motives seem to motivate aid allocation for most donors.
For those interested, see Axel Dreher, Peter Nunnenkamp and Rainer Thiele. 2006. Does US Aid Buy UN General Assembly Votes? A Disaggregated Analysis, Kiel Institute for the World Economy Kiel Working Paper 1275. Panel data for 143 countries over the period 1973-2002; on the influence of US aid on voting patterns in the UN General Assembly.
Findings: strong evidence that US aid buys voting compliance in the Assembly. For other G7 donors, no comparable patterns emerge.
- The debates on the inefficiency of tied aid
OECD tied aid definition: financing provided by donor governments on concessional terms, in the form of a grant or a 'soft' loan, that contractually binds developing country recipients to procure capital goods from the country.
A significant share of aid is tied, conditioning financial flows to the purchase of equipment or a technical assistance from the donor country.
In 1997, bilateral ODA commitments untied for the DAC countries=83.2%; in 2002=84.8%, in 2003, 92% (see WB WDI 2005). In some countries, aid totally untied.
See on the example of tied aid in Ghana, Aryeetey, Osei and Quartey 2003 Does Tying Aid Make it More Costly? A Ghanaian Case Study: aid would have a greater impact if no donor conditionality.
Procurement process= 75% of projects examined not competitively derived= undue 'monopoly' power leads to higher prices and reduces the impact of tied aid projects. Loss of resources through aid tying +tied aid projects do not help to strengthen local capacity: contracts for services are usually single-sourced and do not involve local contractors.
But there have been improvements: see Easterly 2007. Are Aid Agencies Improving?

- Recurrent absence of rigorous ex post evaluation among most donors
Weak monitoring of donor performance (see Helleiner 2003 Towards Balance in Aid Relationships).
Randomised methods claim to be the best means of a rigorous evaluation of the effectiveness of projects: see Duflo and Kremer 2003 Use of Randomization in the Evaluation of Development Effectiveness.
See Kremer and Miguel, 2004, The Illusion of Sustainability: on the example of health projects (worm control): the sustainability of aid projects is an illusion= using external interventions to promote sustainable voluntary provision of local public goods is unrealistic.
- A well-known problem: the lack of coordination and coherence among donors
Foreign aid mostly as an industry benefiting donors, a business, with often no direct link with development: see Raffer and Singer 1996, on the foreign aid business
Aid is not always going to the needy, behind official requisites of 'good governance': political motives
àincoherence between donors is an intrinsic dimension of aid. See Nunnenkamp 2002 Shooting the Messenger of Good News: a Critical Look at the World Bank's Success Story of Effective Aid:
Not only for bilateral donors, but also for the IFIs: e.g. WB claim aid address poverty, while a great share of its contributions went to rescue packages for emerging markets.
Incoherence, multiplicity of agencies and procedures (see OECD 2003, Harmonising Donor Practices for Effective Aid Delivery, Paris, OECD)
For decades: attempts of reforming aid, e.g., attempts of building a common approach of aid among the donors (e.g. the SPA for SSA).
See Bigsten 2006. Donor Coordination and the Uses of Aid. On donor coordination, donor proliferation and how coordination modalities have evolved over time, in particular during the current phase with partnership and ownership + impact of coordination on transaction costs and public-sector management and governance.
A key issue: how donor coordination affects the incentives of the recipient government.
- Aid is a game with multiple principals (donors). Typically: aid affected by the 'Samaritan dilemma':
See Svensson 2005. Absorption Capacity and Disbursement Constraints: the recipient government knows that the foreign aid is governed by poverty alleviation, therefore it has little incentives to exert high effort (or channel its own resources) toward this objective. Interventions that would assist the poor are implicitly taxed, if these interventions result in that less aid is received in the future.
'Samaritan's dilemma' made worse by moral hazard problems: the donor cannot perfectly distinguish if a poor outcome is the result of low effort (bad policies) or bad luck.
à Important transaction costs stemming from aid, coordination failure: among donors, incomplete information about the other donors' aid
+ information problem extended to the recipient countries=not aware of donor activities in any detail ex ante, and even ex post.
E.g., in Vietnam in 2002, 25 official bilateral donors, 19 official multilateral donors and 350 international NGOs, i.e. 8,000 projects: in a game-theoretical perspective the model (2 donors, one recipient): see Halonen-Akatwijuka, 2004, Coordination Failure in Foreign Aid.
However, possible unexpected effects of better coordination = tighter constraints for recipient governments: reduced room of manoeuvre.
= not all the forms of coherence are desirable, e.g. if they only promote Washington consensus types of reforms….
- The negative consequences of the proliferation of aid projects and donor initiatives
See Roodman, 2006. Aid Project Proliferation and Absorptive Capacity: the number of projects nearly tripled between 1995 and 2003.
See Roodman 2006. Competitive Proliferation of Aid Projects: A Model
See Killick. 2008. Taking Control: Aid Management Policies in Least Developed Countries
Box 1: Examples of the complexity of the aid system
• Uganda has over 40 donors delivering aid in-country. The Government of Uganda's own figures show that it had to deal with 684 different aid instruments and associated agreements between 2003/2004 and 2006/2007 for aid coming into the central budget alone.
• A 14-country survey by the OECD and the World Bank showed an average of 200 donor missions per year, three-quarters of these by a handful of donors (the 'chronic travellers'). Cambodia and Vietnam received 400 missions each, Nicaragua 289, Bolivia 270 and Bangladesh 250.
• There are 90 global health funds.
• St. Vincent, with a population of 117,000, was asked to monitor 191 indicators and Guyana, with 169 indicators, on HIV/AIDS.
Source: Reproduced from Burall and Maxwell, 2006, who provided specific source references
Aid means a detrimental increase in transaction costs for recipient countries and civil services:
See World Bank-IDA 15 (2007), Aid Architecture: an Overview of the Main Trends in Official Development Assistance Flows, Washington D. C., the World Bank: continuous increase over time of the number of donors: the average number of donors per country nearly tripled over the last half century, rising from about 12 in the 1960s to about 33 in the 2001-2005 period, and the number of international organisations, funds and programs is now higher than the number of developing countries they were created to assist.
Inherent competition between donors. Multiple donors' requirements and administrative procedures, heavy burden on implementation capacities. The health sector is an example of the proliferation of aid channels, with more than 100 organisations involved + fragmentation of aid.
Example of transaction costs generated by aid: Tanzania, with 700 projects managed by 56 parallel implementation units. Half of all technical assistance is not coordinated with the government and the country received 541 donor missions during 2005, with 17% involving more than one donor.
Example (was on the WB website): innumerable agencies, IFIs, other multilaterals, bilateral donors, each with different and complex policies and procedures. Huge numbers of reports, recommendations, but no real change. PRSPs aimed at addressing the problem, little progress +leadership by the IFIs.
For decades, projects of harmonisation of ODA multilateral and bilateral, without any improvement. Different interests, multiplicity of actors, broadened agendas.
The WB highlighted that there were 63,000 donor-funded development projects worldwide: countless demands, guidelines, and procedures, multiple reports, project audits, and procurement assessments for each donor: this overwhelms developing country governments whose resources are thin
à waste of money and time: on average 5 years to achieve the smallest of projects, from evaluation to finish, with often disappointing results.
A UN study: 1,500 projects in Burkina Faso. Bolivia=host to 850 projects. A developing country typically deals with 30 aid agencies across a wide range of social sectors.
On average, each donor sends at least 5 missions/year to oversee their projects: enormous strain on the recipient government: 3 aid missions/week. Impact of aid diluted because delivered by multiple high-cost aid organisations: vast consultancy industry worth US$4 billion a year in SSA.
Many anecdotes/failure: WB: in a forestry project in Vietnam, it took donors 18 months and 150 government workers to purchase 5 vehicles because of differences among the aid agencies over procurement policies. In Bolivia, five donors backed a survey, but each required separate financial and technical reporting: more time in dealing with donor requirements than for the survey. Number of projects, demands to host missions, prepare reports: beyond many SSA countries administrative capacity.
The IFI are aware of these problems: but seem powerless…
See Eckhard Deutscher and Sara Fyson, Improving the Effectiveness of Aid, Finance and Development, September 2008, vol. 45, n°3.
Assessing the problems
The institutional complexity of the global governance of aid presents real difficulties, given that more than 280 bilateral donor agencies, 242 multilateral programs, 24 development banks, and about 40 United Nations agencies are working in the development business. The increasing number of private foundations and the existence of so many nongovernmental organizations (NGOs) add to the complexity. The proliferation of donor activities—including an estimated 340,000 development projects around the world—leads us to question current ways of managing the aid business.
Indeed, a slew of factors combine to make aid effectiveness less than optimal. They include lack of aid predictability, issues of coordination among the large numbers of donors, and aid fragmentation—all of which have real implications at the country level.
Lack of predictability. According to preliminary data, a recent Survey on the Implementation of the Paris Declaration (OECD-DAC, 2008a) showed that in any average country only 45 percent of aid arrives on time, as scheduled by donors. This lack of predictability means that government authorities in developing countries will have difficulty planning or responding to citizens' needs if funding does not arrive when new hospitals and classrooms were promised.
Lack of coordination. Uncoordinated aid also creates problems. In 2005, government authorities in Vietnam received 791 visits (missions) from donors—that is, more than two a day, including weekends and holidays (OECD-DAC, 2006). In Tanzania, for instance, health workers in some districts spent more than 20 days a quarter—almost 25% of their working days—writing reports for different donors. Given the lack of capacity at the country level and the precedence given to responding to donor demands, it is difficult to imagine how civil servants can focus on things that really matter.
Aid fragmentation. Fragmentation of aid at the country level is getting worse. Fragmentation occurs not only with the increase in the number of donors but also the proliferation of donor-funded activities. This all too often imposes a heavy burden on developing countries and capacities, and reduces the sustainability and value of the aid received (see map).

A survey by the Development Assistance Committee (DAC) of the Organization for Economic Cooperation and Development (OECD) on the scaling up of aid (OECD-DAC, 2008b) shows, for example, that in 2005-06, 38 developing countries received official development assistance (ODA) from 25 or more DAC and multilateral donors. In 24 of these countries, 15 or more donors collectively provided less than 10% of that country's total aid but typically each required the developing country to apply their respective and differing procedures and standards.
At the same time, some states suffer from a lack of attention by the donor community with only 10 donors in total. It is time to look critically at the fragmentation of aid and to foster the capacity of governance systems and mechanisms to adjust where donor presence is clearly suboptimal.
- Aid is ineffective because if expresses firstly the objectives of the bureaucracy of aid.
See Martens. 2005. Why Do Aid Agencies Exist?, Coasian perspective: Why are there many and different aid organisations and not just one? Why is foreign aid not transferred directly from donor to beneficiary?
With zero transaction costs and fully shared preferences between donors and beneficiaries, there would be no need for aid agencies.
Their role is not so much to transfer funds or goods and services to developing countries, but (a) to reduce ex-ante transaction costs and (b) to mediate between the diverging preferences of donors and recipients, and package aid flows in a contract that reduces ex-post uncertainties for donors.
· These are typically the positions of William Easterly. See Easterly, 2006, The White Man's Burden: Why the West's Efforts to Aid the Rest Have Done So Much Ill and So Little Good.
National and international aid bureaucracies are a failure, because measure output as money disbursed rather than service delivered; produce mostly reports and 'frameworks'
+little ex-post evaluation; no memory, no history, no learning from the past+enormous demands on scarce administrative skills in poor countries: see Easterly 2003, Cartel of Good Intentions.
For those interested, see Easterly, 2005. How to Assess the Needs for Aid? The Answer: Don't Ask, AFD conference: innumerable plans assessing "the need for aid': all useless, and denote a central planning mentality: the answer to poverty is a large bureaucratic apparatus to dictate quantities of development goods and services by administrative fiat.
For Easterly: the planning mentality linked to discredited theories, i.e. 'poverty traps', which can only be alleviated by a large inflow of aid to fill a "financing gap" for poor countries: aid inflow of course administered by planning apparatus.
This is a typical bureaucracy approach, relying on 'traps', justifying aid by gaps filling (as defended by the UN, or J Sachs), and is wrong.
Historically poverty never been ended by central planners, but by exploring economic and political solutions by trial and error: e.g., private firms, democratically accountable politicians, even non-democratic politicians with pragmatic, gradualist policies.
For Easterly, aid in fine has been a mistake? See Easterly 2007. Was Development Assistance a Mistake?: development assistance has failed to achieve development. Over the past 42 years, $568 billion (in today's dollars) has flowed into Africa, yet per capita growth of the median African nation has been close to zero. The top quarter of aid recipients (heavily overlapping with Africa) received 17% of their GDP in aid over those 42 years, yet they also had near-zero per capita growth. Successful cases of development happening due to a large inflow of aid and technical assistance have been hard to find. South Korea is often cited, but it took off after aid was reduced, and the Koreans disregarded the advice of the aid donors.
See Easterly 2007. Are Aid Agencies Improving?: weak evidence of progress in response to learning from experience, new knowledge, or changes in political climate. Few positive results: an increased sensitivity to per capita income of the recipient, a decline in the share of food aid, a decline in aid tying. Most of the other evidence – increasing donor fragmentation, unchanged emphasis on technical assistance, little or no sign of increased selectivity with respect to policies and institutions, the adjustment lending-debt relief imbroglio – suggests an unchanged status quo, lack of response to new knowledge, and repetition of past mistakes.
See Easterly and Pfutze. 2008. Where Does the Money Go? Best and Worst Practices in Foreign Aid. See below donor fragmentation based on gross official development assistance in 2004. The 10 biggest donors—the United States, Japan, IDA, EC, France, United Kingdom, Germany, Netherlands, Sweden, and Canada—account for almost 79% of the total, while the 20 smallest agencies account for a total of 6.5% of the total.
The multiplication of many small players is actually understated, because many bilateral donors have more than one agency giving aid.

Selectivity: aid going to corrupt or autocratic countries versus aid going to poor countries.

For a similar view, proposing to reduce aid drastically, for those interested, see Robert Calderisi. 2006. The Trouble with Africa. Why foreign aid isn't working, New Haven, Yale University Press.
- The problems of NGOs: additional intermediaries, with questionable representativity: vested interest and political groups, or genuine otherwise voiceless groups?
6. There have been many proposals of reform
- Since the 1990s: many proposals of reform. E.g. the common pool approaches, international public goods
Transactions-cost arguments in favour of programme aid,
See the "Paris Declaration", 2005: focus on budget support: shift to programme aid and ex post assessments, from ex ante conditionality to ex post conditionality, based on assessments of economic performances, ownership….
E.g., SWAPs: sector wide approaches
The key idea of a better predictability of aid resources
Basing aid allocation on final outcome indicators?
See Cordella and Dell'Ariccia. 2007. Budget Support Versus Project Aid: A Theoretical Appraisal: conditional budget support or on project aid?: model shows that budget support is preferable to project aid when the preferences of donors and recipients are aligned, and when assistance is small relative to the recipients' own resources. When donors cannot observe the recipient's type, they may impose higher levels of conditionality to separate committed governments from uncommitted ones.
- Improving donor coordination: the famous UN Millenium Development Goals
Some doubts about their feasibility in SSA…..
Reflections on conditionality and ownership
WB insistence on 'ownership': development programmes must be country-owned, not owned by donors or the World Bank. See the ten case studies in Dollar, Holmgren and Devarajan 2001 on aid and reform in SSA: country ownership is the way to make aid effectiveWhen aid supports a country-owned development strategy → growth
=no more ex ante conditionality; ex post conditionality based on performance indicators as a basis for aid allocations
Reflection on the 'aid contract' between donors and government both program: but the problem=how to change the incentive structure of the aid "contract".
Reflections also on fungibility
See Killick. 2008. Taking Control: Aid Management Policies in Least Developed Countries: aid dependence of many LDCs
Ø averages for 2005: aid per capita (US$) $82
Ø aid as per cent of GNI 18%
Ø aid as per cent of gross capital formation 86%
Donor dominance and the chronic inefficiency of aid delivery systems were supposed to be addressed by the Paris Declaration. But very little implementation…..
- Debates on the ex ante vs. ex post conditionality/aid?
Current practices: budget support: aid committed ex ante
For a formal analysis, see Svensson, 2003. Why Conditional Aid Doesn't Work: explores ex post incentives for the donor to reward good policies, contrary to existing practices. Instead of committing aid ex ante and making aid conditional on reform, the donor centralises the disbursement decision by committing aid to a group of countries. The actual amount disbursed to each individual country would depend on its relative performance.
This explicit linkage of the allocation and disbursement decisions has advantages=it raises the opportunity cost of disbursing aid ex post, giving the donor stronger incentives to reward good policies.
And competition among recipients allows the donor to make inferences about common shocks, which otherwise conceal the recipient's choice of action: so aid more efficient.
- Within the WB, a reflection on 'output-based aid'
=for supporting the delivery of basic services (water, sanitation, electricity, telecommunications, transport, education, health care) where public funding may complement or replace user fees.
=contracting out service provision to a private firm, with payment of public funding tied to the actual delivery of services.
- E.g., the UK positions: no longer demand specific commitments from poor countries to privatise state industries or liberalise trade in return for its aid
See DFID paper, Partnerships for Poverty Reduction: Rethinking Conditionality, March 2005 =attempting to force aid recipients to carry out policies against their will is counter-productiveàdetailed policy conditionality - requiring specific actions in return for aid – 'cannot buy policy change which countries do not want'. Instead of making such policies a prerequisite for aid, long-term poverty reduction plans and benchmarks based on results rather than policies.
Conditionality limited to fiduciary concerns +to ensure aid is not used corruptly or for other purposes.
Principles of country ownership; participatory and evidence-based policy-making; predictability; harmonization.
- The reflections on 'international public goods'
Promoted by the UNDP: approach supposed to improve the coherence among donors: supported at the Monterrey UN conference FFD/Financing for development (see the 'Monterrey Consensus' and the Financing for development Process/FFD promoted in 2002 by the United Nations)
- Specific to SSA: the NEPAD initiative
=focus on private investment, countries "ownership", infrastructure: yearly investments of $64billion (for those interested, see Funke, Norbert and Saleh M. Nsouli. 2003. The New Partnership for Africa's Development (NEPAD): Opportunities and Challenges, Washington D. C., International Monetary Fund, working paper WP/03/69).
Doubts on its effectiveness……
- The US initiative of Millenium Challenge Account (MCA), channelled through USAID, later the Millennium Challenge Corp. (MCC)
=response to the 'aid fatigue' of Republicans Congressmen: idea of selectivity of aid reserved to the countries having 'good policies' and 'sound institutions'
March 2002: US government promises: increasing foreign aid by 50 % over the next 3 years by creating a Millennium Challenge Account (MCA)=provides $5 billion per year to a select group of countries with sound policies and honest governments.
For the CGD, it is a major foreign aid initiative=16 indicators of country performance for the selection of countries eligible for MCC aid (some from Burnside and Dollar policy measures). See the Center for Global Development website, Steve Radelet studies
Similarly, doubts on its effectiveness…
See Bush Has Quietly Tripled Aid to Africa Increase in Funding to Impoverished Continent Is Viewed as Altruistic or Pragmatic, Michael A. Fletcher, Washington Post, Sunday, December 31, 2006: dramatic increase in U.S. aid to Africa. The president has tripled direct humanitarian and development aid to the world's most impoverished continent since taking office and recently vowed to double that increased amount by 2010 -- to nearly $9 billion. Bush has increased direct development and humanitarian aid to Africa to more than $4 billion a year from $1.4 billion in 2001, according to the Paris-based Organization for Economic Cooperation and Development. And four African nations -- Sudan, Ethiopia, Egypt and Uganda -- rank among the world's top 10 recipients in aid from the United States. (…) Some advocates suspect that the Bush administration's interest in Africa is motivated more by business ambitions than altruism. Grants made by the Millennium Challenge Corp., a foreign aid program developed by Bush with the aim of rewarding poor countries that practice good governance, are also partially predicated on whether countries have open markets that allow widespread foreign investment.
- Since the WTO Hong Kong Ministerial end-2005, a focus on 'Aid for Trade':
I.e. assistance has to focus more on infrastructure, trade policy and regulations, trade development.
· The emergence of 'non-traditional donors'
Finance and Development, September 2008, vol.45, n°3, The Next Frontier Masood Ahmed. Making aid work better
The second challenge is to make aid more effective. About half the low-income countries continue to depend heavily on external aid to finance their development programs. After nearly two decades of stagnation, aid volumes have begun to rise significantly in recent years, and a concerted international effort is attempting to make aid more effective in reducing poverty and promoting development. Many new donors have entered the development financing arena. This scaling up of aid has brought fresh opportunities for recipient countries, but also put pressure on donors and recipients to make sure that aid is used and managed effectively (see "Improving the Effectiveness of Aid" on p. 15 in this issue).
The emergence of "nontraditional" bilateral donors (that is, those who are not members of the OECD's Development Assistance Committee, or DAC), global funds, private foundations, corporations, and nongovernmental organizations is changing the donor landscape. The non-DAC bilateral donors, which outnumber the 23 DAC donors, include Brazil, China, India, Malaysia, Russia, Venezuela, Saudi Arabia and other oil-rich countries in the Middle East, as well as some recent members of the European Union. Together these donors are estimated to have provided more than $12 billion in financing in 2006. According to some estimates, China and India are providing about $3 billion in combined aid a year, and both are developing larger aid programs.
Alongside new donor countries, global funds that are focused on specific objectives, especially in the health sector, are fast becoming prominent vehicles for the delivery of financing and programs. Integrating these "vertical funds" into a country-based "horizontal delivery infrastructure" is a priority for aid effectiveness. And private donors, including major foundations, are also contributing a substantial amount of aid. For instance, the Bill & Melinda Gates Foundation alone provided more than $2 billion in grants in 2007. In addition, according to OECD estimates, nongovernmental organizations in DAC countries are providing a significant amount of funding.
These new players are bringing additional financing, fresh ideas, and new business models into development financing. But the proliferation of donors with smaller shares of total aid is also raising issues of more effective project selection and aid delivery and management (Kharas, 2007). For instance, the average number of donors per country increased from 12 in the 1960s to about 33 during 2001-05. There are more than 230 international organizations, funds, and programs that provide aid—more than the number of developing countries they are meant to assist. Managing aid flows from many different donors is difficult for recipient countries with insufficient administrative capacity, because different donors insist on using their own processes for implementing and monitoring projects. This points to the need for donors to harmonize aid procedures to deliver better-quality aid that can be better managed by recipient countries.
The Paris Declaration on Aid Effectiveness, adopted in 2005 by donor and recipient countries, sets out 56 commitments for better delivery and management of aid. Its implementation has already spurred important reforms of the aid system, though a lot remains to be done for donor programs to be effectively aligned behind country-based priorities (see "A Work in Progress" on p. 20 in this issue). Key issues are aligning aid priorities better with recipient country goals, ensuring continued debt sustainability, and making aid more predictable. From the recipients' perspective, it is important that the countries that have recently benefited from debt relief ensure that, in accessing increased financing, they don't build up unsustainable debt burdens again.
- China: a new donor….
For those interested, see Li Xiaoyun College of Humanities and Development, Agricultural University, Beijing 2008, China's Foreign Aid and Aid to Africa: overview, OECD DAC POVNET. From 1991 until now: the phase of financial aid and technical assistance with integrated-objectives. China's foreign aid had since 1990s entered a new period which emphasized on reciprocity and mutual benefit, economic benefits, the integration of the political interest and the obligations of a "big country". After the ending of the Cold War, in order to comply with the global trend, China has made reforms on its foreign aid, and increased the amount of the aid fund and expanded the coverage of recipient countries, it also made adjustments in concrete forms of its aid. During the period of 1991 to 2005, China's foreign aid expenditure rose from 1.68 billion RMB, with the proportion of 0.08% in GNP and 0.50% in financial expenditure in 19991 up to 7.47 billion RMB, with the proportion of 0.04% and 0.22% in GNP and financial expenditure respectively. And China had chosen Africa as the main recipient area of its foreign aid. Since the past 50 years, China's foreign aid to Africa has amounted to 44.4 billion RMB covering 30% of the total amount of 120.773 billion RMB. These foreign aid to Africa has sponsored about 900 infrastructure and social development projects.
See Aid Overseas charity May 13th 2008, Economist.com. Who gives most in private aid to poor countries? America's government is frequently accused of stinginess when it comes to foreign aid: the official sort is just a tiny proportion of annual GDP. But donations from individuals and businesses are startlingly high. American private giving to poor countries amounted to $34.8 billion in 2006, dwarfing that of other rich nations, according to the Index of Global Philanthropy published on Monday May 12th by the Hudson Institute, a think-tank. An established culture of philanthropy and charity contributes to direct aid-giving, as does a generous tax regime.
|


No comments:
Post a Comment