Outline
4. Important players regarding FDI: transnational corporations
5. A key theoretical debate: the effects of FDI – effects on growth, and other effects
6. The other important theoretical debate: the determinants of FDI
7. Cautious views: positive vs. negative impacts of FDI
1. Defining FDI?
- Defining investment: a difficult issue.
See the various UNCTAD World Investment Reports/WIR, e.g. the WIR 2006; see WB Global Development Finance/GDF reports.
There are different forms of international financial flows or development finance: direct investment; equity investment or portfolio flows (existing shares, new shares); aid; debt.
Direct and equity investment confers on the investor the ownership of assets.
Bonds issues and loans produce a regular stream of payment obligations, while the return on direct and equity investment is determined by the financial performance of the investment.
Direct investment is the purchase or construction of productive capacity in a country by a firm outside the country, vs portfolio equity investment, which is the purchase of shares in a firm, often through a stock exchange.
However: distinctions may be blurred: the purchase of shares above 10% of the total capital of a firm is classified as direct investment, not portfolio investment. Because direct investment entails majority ownership by the foreign investor.
See the definitions in UNCTAD WIR 2007, WIR 2008.
Transnational corporations (TNCs) are incorporated or unincorporated enterprises comprising parent enterprises and their foreign affiliates.
A parent enterprise is defined as an enterprise that controls assets of other entities in countries other than its home country, usually by owning a certain equity capital stake. An equity capital stake of 10% or more of the ordinary shares or voting power for an incorporated enterprise, or its equivalent for an unincorporated enterprise, is normally considered as the threshold for the control of assets.
A foreign affiliate is an incorporated or unincorporated enterprise in which an investor, who is a resident in another economy, owns a stake that permits a lasting interest in the management of that enterprise (an equity stake of 10% for an incorporated enterprise, or its equivalent for an unincorporated enterprise).
In WIR, subsidiary enterprises, associate enterprises and branches are all referred to as foreign affiliates or affiliates.
See the definition in UNCTAD WIR 2007, 2008
Foreign direct investment (FDI) is defined as an investment involving a long-term relationship and reflecting a lasting interest and control by a resident entity in one economy (foreign direct investor or parent enterprise) in an enterprise resident in an economy other than that of the foreign direct investor (FDI enterprise or affiliate enterprise or foreign affiliate). FDI implies that the investor exerts a significant degree of influence on the management of the enterprise resident in the other economy.
Such investment involves both the initial transaction between the two entities and all subsequent transactions between them and among foreign affiliates, both incorporated and unincorporated. FDI may be undertaken by individuals as well as business entities.
Flows of FDI comprise capital provided by a foreign direct investor to an FDI enterprise (either directly or through other related enterprises), or capital received from an FDI enterprise by a foreign direct investor.
FDI has three components: equity capital, reinvested earnings and intra-company loans.
Equity capital is the foreign direct investor’s purchase of shares of an enterprise in a country other than its own.
Reinvested earnings comprise the direct investor’s share (in proportion to direct equity participation) of earnings not distributed as dividends by affiliates, or earnings not remitted to the direct investor. Such retained profits by affiliates are reinvested.
Intra-company loans or intra-company debt transactions refer to short- or long-term borrowing and lending of funds between direct investors (parent enterprises) and affiliate enterprises.
FDI stock is the value of the share of their capital and reserves (including retained profits) attributable to the parent enterprise, plus the net indebtedness of affiliates to the parent enterprise.
FDI flow and stock data used in WIR are not always defined as above, because these definitions are often not applicable to disaggregated FDI data. For example, in analysing geographical and industrial trends and patterns of FDI, data based on approvals of FDI may also be used because they allow a disaggregation at the country or industry level.
See UNCTAD WIR 2003 and 2004: FDI stocks often estimated by either cumulating FDI flows over a period of time or adding or subtracting flows to an FDI stock that has been obtained for a particular year from national official sources or the IMF data series on assets and liabilities of direct investment.
There are non-equity forms of investment (UNCTAD WIR 2007, 2008)
Foreign direct investors may also obtain an effective voice in the management of another business entity through means other than acquiring an equity stake. These are non-equity forms of investment, and they include, inter alia, subcontracting, management contracts, turnkey arrangements, franchising, licensing and product-sharing. Data on these forms of transnational corporate activity are usually not separately identified in the balance-of-payments statistics. These statistics, however, usually present data on royalties and licensing fees, defined as “receipts and payments of residents and non-residents.
The definition of investment matters: see UNCTAD WIR 2003
The definition of “investment” in international investment agreements (IIAs), combined with the substantive provisions, has profound developmental implications, because it defines their scope and reach. For developing countries the key issue is whether investment is defined narrowly, focusing on FDI, or broadly, including virtually every asset connected with foreign investors. Developing countries have indicated a preference for a narrow definition in the discussions of the WTO Working Group on the Relationship between Trade and Investment, but the trend in IIAs has been towards a broad asset-based definition. Even a broad definition can be narrowed, for example, through reservations, affording countries the right to exclude certain types of investment (such as portfolio investment) or by limiting the applicability of specific operational provisions. Another approach is to give each government the choice, when negotiating an IIA, to commit to either a narrow or a broad definition.
1. Why the definition of investment matters
The definition of investment on its own has no direct impact on attracting FDI or benefiting more from it. But defining a certain capital flow or asset as “investment” bestows certain rights on foreign investors and thus facilitates foreign investment. The definition also raises concerns. Obligations to meet financial transfer requirements could for many developing countries at times be difficult to fulfil. Possible complications could arise for macroeconomic management of capital flows of a type and magnitude that may be beyond the control of national governments. And volatile capital flows have implications for domestic financial stability.
· ‘Investment’: there is no fully accepted meaning at a global level.
Internationally accepted method for classifying and recording cross-border foreign investment flows for balance-of-payments statistics: direct investment, portfolio investment, financial derivatives and other investment
+National laws and International Investment Agreements also provide definitions of ‘investment’ and “foreign investment”, which differ considerably from the balance-of-payments definition: e.g., may include, in addition to some types of cross-border investment flows, a wide variety of assets, both tangible and intangible (see UNCTAD WIR 2003).
- FDI implies a direct entry of foreign firms, or acquisition of existing firms.
There are various types of FDI.
- ‘Greenfield’ FDI: new investments, new assets
- Joint ventures,
- Cross-border M&A: acquisition of existing assets e.g. via privatisations.
Privatisations are FDIs if acquisition of more than 10% equity share.
M&As may include the ones between foreign affiliates and firms located in the same host economy: such M&As conform to the FDI definition as far as the equity share is concerned. M&A include purchases via domestic and international capital markets, which are not FDI flows.
M&As use various types of financing, e.g. syndicated loans, corporate bonds, venture capital: see UNCTAD 2002 FDI in Least-Developed Countries at a Glance.
In the 1990s, rise in FDI volume, but also change in FDI composition: acquisition of existing assets/M&A grew more rapidly than investment in new assets/’greenfield’ FDI, particularly in countries undertaking extensive privatisation of public enterprises.
M&A boom=not a pure effect of privatisation, but M&A followed by a rise in greenfield investment. The reverse true only for developing countries: see Calderón, Loayza, Servén 2004 Greenfield FDI and Mergers and Acquisitions.
Some issues concerning FDI statistics: what is behind the numbers? Host countries today generally welcome FDI, on the condition that it will lead to higher value added and/or higher rates of output growth in their economies. FDI flows are expected to represent funds for expenditure on capital formation in host economies.
But in reality not all of the flows shown in FDI data represent external financial resources for investment, because they may have originated in that country itself in the first place (roundtripping), or because they are intended mainly for FDI in some other country (trans-shipping). And, even if they are transshipments, they do not necessarily translate into expenditures to build production capacity in host economies.
See UNCTAD World Investment Report/WIR 2005: problem with FDI data. For data collection purposes, FDI has been defined as involving an equity stake of 10% or more in a foreign enterprise. Different countries have different recording practices. Some countries deviate from the suggested 10% threshold value for foreign equity ownership. Most countries report long-term intracompany loans, but not all countries record short term loans and trade credits. Some countries are still not able to report reinvested earnings, etc.
2. Global trends
See the annual UNCTAD World Investment Reports (WIR), e.g., the UNCTAD. 2006. World Investment Report: FDI from Developing and Transition Economies; see UNCTAD. 2007. World Investment Report 2007: Transnational Corporations, Extractive Industries and Development, WIR 2008, Transnational Corporations and the Infrastructure Challenge.
See also the annual reports by the WB, Global Development Finance.
· FDI is a driving force of globalisation. FDI has risen relative to total capital expenditures during the 1990s. It has doubled in middle-income countries and has tripled in low-income countries: see World Bank GEP/Global Economic Prospects 2003.
New trends: increasingly, developing and transition economies as sources of FDI, and role of TNC from emerging and developing countries as important investors.
The trends of FDI are linked to the tradability ‘revolution’: i.e. the tradability of services, the global trend towards offshoring and outsourcing.
See the UNCTAD WIR 2004 on services: developing countries export a very large array of services, e.g. internet services, financial services, business services (back office, etc), implying low skills (e.g., call centres), medium skills or high skills (e.g., software development).
Services are more open to efficiency-seeking FDIàinformation-intensive services are subjected to the international division of labour and hence integrated international production
Services differ from manufactures: structurally simpler to offshore services, so faster fragmentation of services,
For low-skills services, offshoring of services more footloose than that of manufacturing because (lower capital intensity and sunk costs, weaker links to local suppliers.
High concentration: FDI related to the offshoring of services are concentrated in a small number of countries: Ireland, India, Canada and Israel + other attractive countries=China, Malaysia, Czech Republic, Singapore, Brazil, South Africa.
For SSA, export-oriented FDI in services: call centres. South Africa is the most prominent player + Ghana, Mauritius, Morocco, Senegal, Tunisia (in 2003, more than 400 call centres in South Africa, employing 80,000 people).
- Trends in private investment over history
The WB IFC (Everhart and Sumlinski, 2001,Trends in Private Investment, 1970-2000, Washington D.C., IFC) compiled series/data until 2000: nothing afterwards…
For the developing countries, the ratio of private investment to GDP: in 1998, 15% and 14.1% of GDP in 1999 =16.2% and 15.7% in weighted average terms.
Public investment increased from 7.3% to 7.5% of GDP in simple average terms, and remained at the 1998 level in weighted average terms. The 1999 decline brings investment ratios back to their 1995 level.
- FDI is subject to strong variations from one year to the other
See UNCTAD World Investment Report/WIR 2006: Inflows of FDI were substantial in 2005, rising by 29% (reaching $916 billion). Increase by 27% in 2004. Most inflows went into services, but the sharpest rise in FDI was in natural resources.
See UNCTAD WIR, 2005: recovery. See Commerzbank economic briefing, FDI flows update, March 2005: in 2004, FDI ended a 3 year downturn, with global flows rising by 6% to $612bn. Half was directed towards less developed countries (+48%). Indeed, as a % of developing countries’ GDP, FDI were continuing their decline in 2003, from 2.3 % in 2002 to about 1.9 % in 2003 (see WB GDF 2004). In 2003, net FDI flows to developing countries were about $135 billion, small compared with all domestic investment in developing countries, about $1 trillion.
Cross-border trade and direct investment expanded rapidly over the past three decades. Global exports of goods and services increased from 14% of output in early 1970s to 23% by late 1990s + global FDI flows have more than doubled relative to the GDP. The surge in FDI flows accelerated in the late 1990s. Most of these flows go to rich countries.
See UNCTAD WIR 2004: TNCs from developed countries drive the growth of world FDI flows. But, increasingly, TNCs from developing countries. Developed countries continue to account for over 90% of total outward FDI.
· Recent trends
A key interrogation: the impact of the 2008 financial crisis: it is too early…but…
See the World Bank analysis: http://www.worldbank.org/html/extdr/financialcrisis/
Private capital flows are expected to drop from $1 trillion in 2007 to $530 billion in 2009
The financial crisis is threatening to turn back the clock on progress achieved during decades of reforms that have geared economic policy toward ensuring Africa is a more attractive destination for private capital. The crisis has triggered quick depreciation of currencies and major declines in stock market prices with foreign investors in securities and equities selling off large shares of their holdings.
“First, a slowdown in private capital flows will adversely affect economies that had been relying on these flows to finance much-needed investment, particularly infrastructure investment. Already Ghana and Kenya have postponed sovereign bond issues worth about $800 million,” he said. “Second, commodity prices are falling, which hurts exporters but helps importers.”
See the UNCTAD WIR 2008, Transnational Corporations and the Infrastructure Challenge. Global FDI reached a new record high in 2007, reflecting the fourth consecutive year of growth. With inflows of $1,833 billion, the previous record set in 2000 was surpassed by some $400 billion.

See WIR 2007. Transnational Corporations, Extractive Industries and Development: on TNCs in the extraction of oil, gas, and metal minerals.
Global FDI inflows soared in 2006 to reach $1,306 billion – a growth of 38%, due to strong economic performance in many parts of the world: driven by cross-border M&As and increasingly private equity funds.
Higher prices for many minerals have led to renewed investor interest in the extractive industries. TNCs – with some of the world´s largest corporations- play a key role in the mining of metals and in the extraction of oil and gas. Privately owned TNCs dominate metal minerals, while state-owned companies from developing and transition economies are key players in oil and gas. Many such state-owned firms are emerging as TNCs in their own right.
Forces driving investment change as raw materials progress up the "value chain" to become finished products.
A key question: is there a ‘resource curse’?: TNCs may help or hinder long-term growth…Global FDI inflows rose in 2006 for the 3rd consecutive year, growth shared by all countries. Rising demand for commodities was reflected in a steep increase in natural resource-related FDI, although the services sector continued to be the dominant recipient of FDI. FDI inflows to SSA at record levels. E.g., Gazprom in Nigeria.

· See the World Investment Prospects to 2011, 2007, the Economist Intelligence Unit with the Columbia Program on International Investment (CPII):
Foreign direct investment inflows, The Economist, September 13th 2007: the US and the developed EU are the main recipients of foreign direct investment

Global FDI inflows in 2007 = $1.5 trillion (World Investment Prospects to 2011).
Foreign direct investment inflows (US$ bn) (source, WIP 1011) | |||||||||
| 2003 | 2004 | 2005 | 2006 | 2007 | 2008 | 2009 | 2010 | 2011 |
World FDI inflows | 563.4 | 730.2 | 971.7 | 1,335.1 | 1,474.7 | 1,406.4 | 1,470.3 | 1,536.8 | 1,604.0 |
% change, year on year | -8.8 | 29.6 | 33.1 | 37.4 | 10.5 | -4.6 | 4.5 | 4.5 | 4.4 |
% of GDP | 1.5 | 1.8 | 2.2 | 2.8 | 2.8 | 2.5 | 2.5 | 2.4 | 2.4 |
FDI inflows to developed countries | 354.6 | 379.5 | 546.8 | 824.4 | 940.2 | 879.0 | 925.5 | 972.6 | 1017.3 |
% change, year on year | -15.8 | 7.0 | 44.1 | 50.7 | 14.0 | -6.5 | 5.3 | 5.1 | 4.6 |
% of GDP | 1.3 | 1.2 | 1.7 | 2.4 | 2.6 | 2.3 | 2.3 | 2.3 | 2.4 |
% of world total | 62.9 | 52.0 | 56.3 | 61.7 | 63.8 | 62.5 | 62.9 | 63.3 | 63.4 |
FDI inflows to emerging markets | 208.9 | 350.7 | 424.9 | 510.7 | 534.6 | 527.4 | 544.8 | 564.2 | 586.7 |
% change, year on year | 6.0 | 67.9 | 21.1 | 20.2 | 4.7 | -1.3 | 3.3 | 3.6 | 4.0 |
% of GDP | 2.4 | 3.4 | 3.5 | 3.6 | 3.3 | 2.9 | 2.7 | 2.6 | 2.4 |
% of world total | 37.1 | 48.0 | 43.7 | 38.3 | 36.2 | 37.5 | 37.1 | 36.7 | 36.6 |
- For an overview of FDI in LDCs, see UNCTAD. 2006. FDI in Least Developed Countries at a Glance: 2005/2006 (most recent): see also the country tables
FDI inflows into the group of 50 least developed countries/LDCs in 2004 rose to $11 billion, the highest level ever. But small amounts of FDI: in the case of SSA 34 LDCs, although 29 countries recorded higher FDI in 2004 than in 2003, all but the three oil-producing countries (Angola, Equatorial Guinea and Sudan) received less than $1 billion; and 21 received no more than $100 million.
For LDCs as a group, FDI inflows are small in absolute terms.
For those interested, for the group of low-income countries, see Thomas Dorsey, Helaway Tadesse, Sukhwinder Singh, and Zuzana Brixiova. 2008. The Landscape of Capital Flows to Low-Income Countries, IMF Working Paper WP/08/51.
B. Private Financing for LICs
Private-source inflows to LICs have grown more than fourfold since the 1980s (Figure 3, Table 1 and 2). While there are many sources of private sector inflows, the inflows to LICs have been overwhelmingly non-debt-creating and have been dominated by FDI and private transfers (e.g., remittances). 7
The most striking aspect of the shift in capital flows to LICs is the more than ten-fold increase in FDI as a share of LIC GDP between the 1980s and 2006. FDI inflows averaged only 0.2 percent of LIC GDP in the early 1980s, but rose steadily to more than 3 percent of GDP by 2006.
Only slightly less striking is the rise in private transfers. Private current transfers more than tripled as a share of LIC GDP since the 1980s, rising from 1.1 percent of GDP in the early 1980s to 3.6 percent of GDP in 2005. In principle, private transfers can be decomposed into workers’ remittances and other (likely smaller) types of private transfers. However, data problems preclude such a decomposition for LICs. Also, other categories that might contain remittances fall outside private transfers, but these are also difficult to disentangle from the data. In the absence of better alternatives, private transfers is used as a proxy for remittances in this paper; because the biases associated with data problems go in opposite directions, it is difficult to determine whether using private transfers understates or overstates total remittances (see Box 3).
Private inflows other than FDI and private transfers averaged only about 0.5 percent of LIC GDP in the 1980s and 1990s, but rose just above 1% of GDP in the 2003–06 period. Flows in this group have been volatile, but there appears to be a shift from unsecuritized debt (e.g., commercial bank loans and trade credit) to securitized portfolio investment within this category. Commercial bank loans and other private, debt-creating liabilities of LICs have risen over the last quarter century, but they have done so from a very low base, and they remain a minor component of aggregate private inflows to LICs.
(…)
C. Resources Endowments: Is This Investment Related to the Commodity Boom?
Mineral endowments appear to be an important determinant of private investment, particularly in the recent period of sharply rising prices for oil and other commodities.
Private investment in LICs, in particular FDI, has often been associated with extractive industries. While WEO data are not available by sector, it is possible to group countries by their mineral resource endowments. This section divides LICs into “hydrocarbon-rich,” “mineral-rich,” and “non-mineral” countries based on the classification of countries in the IMF’s Guide to Resource Revenue Transparency.
Private inflows to hydrocarbon-rich economies have been higher than to other LICs, although not overwhelmingly so and with signs that non-mineral LICs may be catching up. The difference is largely explained by FDI inflows to hydrocarbon-rich LICs. In most other respects, there is little difference between hydrocarbon-rich, mineralrich, and non-mineral LICs in terms of trends and levels, although inflows to hydrocarbon-rich and mineral-rich are more volatile than those to non-mineral LICs.
3. Trends for SSA
- See UNCTAD World Investment Report/WIR 2008, 2007, 2006, and the other WIRs.
See UNCTAD. 1995. Foreign Direct Investment in Africa. UNCTAD. 1999. World Investment Report 1999: Foreign Direct Investment; UNCTAD. 2002. FDI in Least-Developed Countries at a Glance. UNCTAD. 2002. World Investment Report 2002: Transnational Corporations and Export Competitiveness, and the following WIRs.
- See IMF, Regional Economic Outlook: Sub-Saharan Africa, October 2008.

See Department of Economic and Social Affairs Division for Sustainable Development, Trends in Sustainable Development: Africa Report, UN, New York 2008

Domestic savings and investment remain low. Relative to developing countries in Asia and Latin America, sub-Saharan Africa has the lowest investment ratios. Over the period 2000-2005, domestic investment as a proportion of GDP remained stable at 18 per cent in sub-Saharan Africa, while growing from 30 to 36 per cent in East Asia and the Pacific. Low savings are a main factor for the observed low investment rate in the region. Over the period 2000-2005, domestic savings as a proportion of GDP were 17% in sub-Saharan Africa and 26% in the Middle East and North Africa. In East Asia and the Pacific, they reached more than 40% at the end of the period. There are wide differences in savings patterns across countries. Botswana, the Congo, Gabon and Nigeria have savings rates greater than 30%. The majority (28 countries) of the remaining countries in the region for which data are available have positive but low savings ratios. Eleven countries had negative savings rates over the period 2000-2004.

External resources are crucially important in financing development in the region. In recent years, the importance of private capital flows has been comparable to that of official flows. However, the former tend to be more volatile as well as concentrated in a few countries in the region. A large part of private capital flows are in the form of equity, as opposed to debt. In fact, between 1998 and 2002 net private debt flows to the region were negative.
This decline in debt was accompanied by a shift from short- to medium- and long-term debt. In turn, a large part of the net equity flows to the region has taken the form of foreign direct investment (FDI), as opposed to portfolio equity inflows. The latter have shown a great deal of volatility, reflecting sudden changes in investors’ perceptions of risks and returns. Aggregate FDI flows have shown less volatility and more than doubled from 1998 to 2005. However, the region as a whole, with an estimated $17.6 billion FDI flow in 2005, still attracts less FDI than many individual developing countries.
- See UNCTAD WIR 2008: In Africa, FDI inflows grew to $53 billion in 2007, their highest level so far, despite the global financial crisis. Strong FDI growth in the region for the third consecutive year (figure II.1) was driven by a booming global commodities market, rising corporate profitability of investment and an increasingly FDI-friendly environment. The commodities-market boom also helped drive FDI outflows from Africa amounting to $6 billion, although this was a decline from 2006 when they reached $8 billion. Inflows relative to the region’s gross fixed capital formation stabilised at 21% (figure II.1).
Cross-border M&As in the extraction industries and related services continued to be a significant source of FDI, in addition to new inbound M&A deals in the banking industry. Nigeria, Egypt, South Africa and Morocco were the largest recipients. These cases may illustrate a trend towards greater diversification of inflows in some countries, away from traditional sectors (e.g. oil, gas and other primary commodities).


- See UNCTAD WIR 2007: FDI in Africa peaked: its resources attracted increasing FDI. At $36 billion in 2006, FDI inflows in Africa were twice their 2004 level, due to increased interest in natural resources, improved prospects for corporate profits and a more favourable business climate.
The value of cross-border M&A sales reached a record $18 billion, half of which represented purchases by TNCs from developing Asia. Greenfield projects and investments in expansion also grew significantly.
Despite this increase, SSA share in global FDI fell to 2.7% in 2006, compared with 3.1% in 2005, much lower than that of other developing regions. Outflows from SSA reached a record $8 billion in 2006, up from $2 billion in 2005.
See UNCTAD WIR 2006. SSA attracted higher levels of FDI. In SSA, FDI inflows=from $17 billion in 2004 to an unprecedented $31 billion in 2005. But SSA share in global FDI continued to be low: just over 3%.
South Africa is the leading recipient, with 21% ($6.4 billion) of SSA total inflows (result of the acquisition of ABSA (South Africa) by Barclays Bank (United Kingdom). Egypt=second largest recipient, followed by Nigeria. As in the past, with a few exceptions such as Sudan, most of the region’s 34 LDCs attracted very little FDI. Most of the FDI was in the form of greenfield investments.
Growth is driven by high commodity prices. Total FDI= $31 billion in 2005, representing a historic growth rate of 78% = consequence of a boom in the global commodity market, which led to large inflows into the primary sector, although inflows into the services sector also rose.
Nonetheless, SSA current share in global FDI remains much lower than it used to be in the 1970s and early 1980s, even though in the past three years that share has once more surpassed the region’s share in global GDP and exports.
The decline in SSA share in global FDI over the past two decades reflects its slow progress in increasing production capacity and diversification, and creating larger regional markets. Hence, SSA per capita inflows were only $34 in 2005, compared with $64 for developing economies as a whole.
- See UNCTAD WIR 2005: FDI inflows are mostly investments in primary production. In 2004, SSA FDI inflows remained at the relatively high level reached in 2003 ($18 billion). High prices for minerals such as copper, diamonds, gold and platinum, and particularly for oil, along with the consequent improved profitability of investment in natural resources encouraged TNC investment. Cross-border M&As in the mining industry increased to more than three times their 2003 value.
Although inflows in 2004 were relatively high, Africa’s share in world FDI inflows remained small at 3%.
- See UNCTAD WIR 2004: FDI inflows to SSA rose by 28%, to $15 billion, in 2003, but less than the 2001 peak of $20 billion. Natural-resource rich countries (Angola, Chad, Equatorial Guinea, Nigeria, South Africa) principal destinations. FDI in services is increasing: telecommunications, electricity and retail trade. E.g., in South Africa, more FDI in telecommunications and information technology than in mining and extraction. Developing countries are also outward investors: South Africa: the most important African outward investor= 9th among developing economies in 2003.
- Share of SSA in global FDI inflows: 1% in 2000, 2% in 2001 (exceptional transactions in South Africa). See UNCTAD WIR 2002: if economic size is taken into account, little difference between SSA and other developing countries regarding inward FDIs
= no exceptionalism: some SSA countries receive even more FDI/GDP than the average developing countries.
- In SSA the record of the past 2 decades with respect to attracting FDI has been disappointing.
See UNCTAD 2005, Economic Development in Africa: Rethinking the Role of Foreign Direct Investment.: in most SSA countries FDI flows are more a lagging than a leading factor in the growth process; the role of FDI in SSA cannot be properly assessed independently of the disappointing record of reform programmes with respect to growth, capital accumulation and economic diversification.
FDIs in SSA: disappointing level after 2 decades of adjustment and financial and trade liberalisation. See Ndikumana 2003 on capital flows in SSA: apparent ‘surge’ in FDI, but only because the initial levels of flows to most SSA countries until the early 1980s were extremely low. E.g. the average annual FDI inflows to Zimbabwe= $0.2 million in 1981–1985, increasing to $125 million in 1992–1998; over the same periods, in Zambia, from $19 million to $108 million; in Ghana from $8.5 million to $107 million.
FDI still makes a relatively small contribution to capital formation in SSA
In the 1992–1998 period, FDI as a percentage of gross domestic investment= less than 5% for 17 of 41 countries or less than 10% for 30 countries. Exceptions=Nigeria, Seychelles, Zambia, Angola and Lesotho.
Increasing sectoral diversification of FDI: the returns to investment in the traditional extractive sectors not higher than those in the manufacturing sector (see Ndikumama 2003 for a complete account)
See Basu and Srinivasan. 2002. FDI in SSA: the stock of FDI in SSA increased between 1980 and 2000. Record of $10.5 billion in 1999, declined to 9.1 billion in 2000. Significant increase relative to the flows averaging 3 billion per annum at the beginning of the 1990s. Decline in overall FDI flows to SSA in 2000 – with 70% concentrated in few countries, i.e. Angola, Nigeria, South Africa.
But SSA share of the global stock of FDI declined from 5.3% in 1980 to 2.3% in 2000 =increase in the volume of FDI flows to SSA, but not keeping pace with flows to the other regions of the world. FDI flows averaged 2% of annual global FDI flows in 1989-94, then declined to 0.7% in 2000. As a share of FDI flows to developing countries, SSA share has declined from an annual average of 6.7% in 1989-94 to 4-5% over 1995-2000.
- Characteristics of FDI in SSA: the concentration of FDIs in a few SSA countries.
Inflows are concentrated in particular locations.
See UNCTAD WIR 2008


See UNCTAD WIR 2007: The 10 major recipients of FDI among African LDCs in 2006 were (in declining order): Sudan, Equatorial Guinea, Chad, the United Republic of Tanzania, Ethiopia, Zambia, Uganda, Burundi, Madagascar and Mali.
See Department of Economic and Social Affairs Division for Sustainable Development, Trends in Sustainable Development: Africa Report, UN, New York 2008

In the last decade, the bulk of FDI has been concentrated on a handful of countries. South Africa, Nigeria and Angola alone have represented about half of total net FDI from 1994 to 2005. A large proportion of FDI goes to the oil sector.
Over the last 15 years, 70 % of FDI has been invested in 5 out of the 7 African oil-exporting countries as well as in South Africa. European and North American countries have been the main foreign investors in sub-Saharan Africa. However, FDI from developing countries, particularly from South Africa, China and India, as well as from Malaysia and Brazil, has increased substantially.
- FDI to SSA: a few sectors, and the pre-eminence of the primary sector
See UNCTAD WIR 2008: flows to the primary sector – oil producers – but also other sectors, e.g. in West Africa, privatisation schemes of telecommunications companies. In Kenya they increased due to large privatization sales in the telecommunications industry and investments in railways.
Also a rise in inflows in the service sector, in particular the financial sector.
Transnational corporations/TNCs continued to invest in infrastructure projects in areas such as electricity, telecommunications and water.
See UNCTAD WIR 2007: FDI in SSA driven by the search for new natural-resource reserves in 2006. Following substantial increases in commodity prices, many TNCs, particularly those from developed countries already operating in the region, expanded their activities in oil, gas and mining industries. TNCs from Asia expanded even more rapidly, through both greenfield investments and cross-border M&As
See UNCTAD WIR 2006: FDI flows to SSA in 2005 went mainly into natural resources, especially oil, although services (e.g. banking) also figured prominently. High commodity prices and strong demand for petroleum led to an increase in exploration activities in a number of African countries: Algeria, Egypt, Equatorial Guinea, the Libyan Arab Jamahiriya, Mauritania, Nigeria and Sudan.
TNCs from the US and the EU continued to dominate the industry, but a number of developing country TNCs, such as CNOOC from China, Petronas from Malaysia and ONGC Videsh from India, are increasingly expanding into SSA.
Total FDI into 6 African oil-producing countries – Algeria, Chad, Egypt, Equatorial Guinea, Nigeria and Sudan –= $15 billion, i.e. 48% of inflows into the region in 2005.
See UNCTAD. 2006. FDI in Least Developed Countries at a Glance: 2005/2006: FDI inflows in 2004 still highly concentrated, owing mainly to rising oil demand that led to relatively high levels of FDI inflows into oil-producing LDCs. FDI inflows into the three natural-resources-rich countries (Angola, Equatorial Guinea and Sudan) accounted for nearly half of total inflows of all LDCs. Since 1995, significant offshore oil discoveries in the Gulf of Guinea have made petroleum exploration the major driver of FDI in LDCs in SSA.
See UNCTAD WIR 2003: FDI are mostly made of large projects: oil and petroleum, mining, extractive industries, hotels, manufacturing sometimes. Often co-financed private sector and aid agencies/World Bank, IFC, etc. Examples: the Chad oil pipe line, the Mozambique Mozal aluminium smelter.
See UNCTAD 2005 on FDI in SSA: enclaves in the primary sector. FDI in the mining sector: new opportunities or a ‘race to the bottom’?
But also, though on a small scale, FDI in agro-chains (vegetable, flowers, etc).
- Origins of FDI? FDI to SSA come from a small number of countries.
See UNCTAD WIR 2007: the geographical pattern of FDI is changing, with greater South-South FDI flows.
See UNCTAD WIR 2006: in SSA, the leading source countries= the US and the United Kingdom, France and Germany further behind.
See UNCTAD WIR 2005: The 5 top home countries of FDI for SSA in 2004 were France, the Netherlands, South Africa, the United Kingdom and the US=over half of the flows to the region.
Owing to proximity and history. US TNCs are active in South Africa, and Angola. The US invest in oil sector. The Netherlands FDI went into the primary sector, Germany, Japan, the UK FDI went into services: e.g. UK TNCs very active in banking, finance and trading, Germany TNCs active in construction and real estate.
There are outward FDI from SSA: important role of South Africa, particularly in neighbouring countries: FDIs in a wide range of industries, from mining and processing to banking and retailing. M&A in gold mining in Zambia, breweries in Botswana, Lesotho, Mozambique, Swaziland, Tanzania, Zambia, retailers in Zambia and Mozambique. E.g. Vodacom (South Africa's Telkom) and UK Vodafone, in RDC Congo.
See UNCTAD 2005 on FDI in SSA: South Africa largest investor into the rest of SSA during the period 1990 to 2000, with investments averaging about $1.4 billion yearly, or a total of about $12.5 billion over the decade. Much of this investment was in the second half of the 1990s and was concentrated in neighbouring countries. Only one non-SADC country, Kenya, featured in the top destinations; non-SACU investment is dominated by Zambia and Zimbabwe, both of which have a strong mining heritage. The new investments are concentrated in minerals and energy and, since 2001, include newer countries such as Algeria, Burkina Faso, Equatorial Guinea, Gabon, Mauritania, Morocco and Sao Tome and Principe.
Asian firms also invest in SSA (India and Malaysia), e.g. telecommunications and real estate, particularly in South Africa neighbouring countries, e.g. Botswana, from where they can produce at low costs and export to the South African market.
- Types of investment? Greenfield investment vs cross-border M&A?
Bulk of FDI in LDCs is through greenfield investment: deals made not by local firms but by foreign affiliates. Limited M&A; many privatisation programmes limited the participation of foreign investors.
But change: see WIR 2007: large cross-border M&As as well as greenfield investments and expansion projects played an important role in the top African host countries, e.g. Nigeria.
Evolution: the increase of private equity:
See Thomas Dickinson OECD Development Centre, www.oecd.org/dev/insights. Policy Insights 60, April 2008. Private Equity: An Eye for Investment under African Skies? (based on the African Economic Outlook 2008)
Private equity is the African investment story to watch. African countries have made serious efforts to attract foreign investment. Global downturn may yet put successes at risk. Private equity is not a new phenomenon in Africa but it is drawing increasing attention as a nimble and innovative vehicle for private-sector development on the continent. Improvements in African investment environments and a series of spectacular African business successes (such as the private-equity backed African telecommunications pioneer Celtel’s USD3.4 billion buyout in 2006) have fuelled an unprecedented boom in the size and breadth of African private equity funds.
A huge increase in mergers and acquisitions (M&A) in 2006, notably in African banking and telecoms, brought high exposure to the dynamism of the continent’s private sector and boosted investment to record figures: foreign direct investment flows reached USD 36 billion in 2006, twice their level of 2004 1.
Private Equity from Emerging Markets
The sharp increase in private-equity investment from global emerging markets was mirrored in sub-Saharan Africa, which saw funds raised shoot up nearly 200% 2 in 2006, to USD 2.3 billion. This brought sub-Saharan Africa’s share of emerging market private equity funds to 7 %, which although well behind Asia (58 %), held up well compared to other emerging regions (Latin America:8%; Middle East/North Africa: 8%; CEE/Russia:10%). Funds focusing on North Africa/Middle East grew by 50 per cent over the period.
_______________________________
1. Source: UNCTAD (2007) World Investment Report, Geneva and UNCTAD (2007) Global Investment Propects Assessment 2007-2009, Geneva.
2. African Venture Capital Association, South African Venture Capital Association, 200

African funds, while still small by international standards, have been rapidly increasing in both size and reach: Pamodzi, a South African private-equity firm, launched the continent’s largest, USD1.3 billion, pan-African fund in 2007. International financial institutions have also developed their own vehicles: Citigroup launched aUSD200 million fund early that same year.
The South African private-equity industry, mirroring the country’s financial predominance, is the largest on the continent, at 1.7 per cent of GDP — a figure comparable to that of many developed markets (Europe: 1.5 per cent; UK: 3.7 per cent; North America: 2.8 per cent) , and 17th in the world in terms of investment activity (2005). South Africa saw a 409 per cent increase in managed funds in 2006, to 11.2 billion rand (USD1.6 billion). South African funds manage over 80 per cent of total SSA private-equity capital, followed by Nigeria with 10 per cent.
Channel for Investment
Developed economies, particularly the United States, remain the major source of capital, accounting for 50 % of total funds raised for African investment in 2006 (Europe 9%). A quarter of the funds raised for the continent are South African, continuing a trend of growing local sourcing of capital. For the first time, a third of the capital raised in South Africa was also sourced through foreign pension and endowment funds, revealing institutional investors’ growing appetite for, and confidence in, African assets.
Public funds, particularly from European development finance institutions are also important sources of capital. Seeking to foster private-sector activity, these government-backed agencies have historically been important guarantors of private investment funds on the continent. Representative of this field is France’s Proparco, Dutch FMO and Britain’s CDC (formerly Colonial Development Corporation), with USD845 million commited in Africa since 2004 through twelve African fund managers.
Openness to Foreign Investment
Over recent years, African governments have made serious progress in adopting market-friendly policies, improving investment environments and taking energetic steps to stimulate foreign involvement. New measures promoting foreign investment were introduced by 40 African countries in 2006. Foreign participation in the telecoms industry was allowed in Botswana, Burkina Faso, Burundi, Cape Verde, Ghana and Namibia. Important reforms of the banking sector took place in Congo, Egypt and Nigeria. Morocco legalised foreign ownership of large tracts of land. Several countries eased registration and taxation constraints on new businesses and established special investment zones.
A Source of Diversified Financing
The global boom of recent years pushed demand for African assets to new heights. Low correlations with global markets, high liquidity and the commodities boom all fuelled investment, but also contributed to pushing non-primary sector opportunities into the background. Private equity, on the other hand, has tended to work against the grain of international investment, focusing its attentions on consumer-related and communications sectors. Such investments have an arguably stronger impact on Africans’ daily lives than the largest of extractive mega-projects, and bring private equity to stand out as a dynamic and diversified counterpoint to classic sources of foreign investment in Africa.
- The political economy dimensions of FDI in the primary sector
African free-for-all? Aug 30th 2007, The Economist Intelligence Unit. Attractive investment destinations remain repressive. Resource-rich countries attract more investment, but are more likely to be politically repressed, and thus unstable.
(..) according to the annual classifications undertaken by US-based think-tank Freedom House (..) there appears to be very little if any correlation between political freedom and a national economy's rate of expansion. The fastest-growing African economy since 1998 has been politically un-free Equatorial Guinea, with growth averaging 26% a year. Other repressed economies with high growth rates include oil exporters Angola and Chad. One tentative conclusion to be drawn from the freedom data is that richer then economy—in terms of oil or minerals—the greater the degree of political repression. The average freedom score for 12 resource-rich countries, mostly oil exporters but including mineral exporters like Botswana, DRC, Namibia and Zambia, is materially worse than that of 20 agricultural or diversified economies (at 4.66, as against 3.4).
Resource nationalism
Clearly, this is a matter of concern to businesspeople. Resource-rich countries, especially the oil exporters, attract more foreign direct investment than resource-poor or agricultural economies. But low levels of political freedom in mineral- and oil-rich economies (Botswana and Namibia are exceptions) implies greater political instability, with potentially adverse repercussions for foreign investors.
It seems too that the resurgence of “resource nationalism” around the world, especially in Latin America and the Middle East, but also in African states like Angola, Nigeria, Sudan, Equatorial Guinea, Congo and Chad, is positively correlated with political repression. The more determined the government to control a country’s natural resources, the greater the probability that political freedoms will be suppressed.
None of this is particularly surprising. Returns are greater in high-risk Nigeria, Angola, Sudan or the DRC than in South Africa, Kenya or Ghana. In other words, the correlation is not between political freedom and economic performance, but between political suppression and risk. The fewer the political freedoms, the greater the risk—and the higher the returns. For companies and potential investors, the challenges are those of risk evaluation and risk management. There is a temptation for oil companies to conclude that because Equatorial Guinea has a strong military ruler the risks of political instability are low, while the returns are way above average. That however, is the wrong conclusion. The higher the return, the greater the risks (economic, business and political) of a sudden, unexpected change in fortunes. Risk management is about predicting and anticipating change—as in Zimbabwe in 2007—not about believing that the status quo will last indefinitely.
· A new major player in SSA: China: see the Lecture on Trade
Not only China: India as well…
(See BBC news: 2006/08/14: India to put $1bn in African oil: India plans to invest $1bn (£528m) into develop oil and mining projects in Africa's Ivory Coast over the next five years).
For those interested, see Ryan J. Orr and Jeremy R. Kennedy (2008), Research Note: Highlights of Recent Trends In Global Infrastructure: New Players And Revised Game Rules, Transnational Corporations, UNCTAD, vol. 17, n°1, April.
Chinese investors and the Government of China are taking a growing role in infrastructure investment in Africa and other parts of the emerging world. (…)
New geopolitical strategic investors: China. Chinese trade and foreign investment are growing strongly. Trade has doubled, while foreign investment has grown by a factor of eight (IMF, 2006). Trade flows between China and Africa have shown particularly strong growth, much of it driven by the development of petroleum and mineral resources (Broadman, 2006).13 A large part of the infrastructure being developed in Africa involves extractive infrastructure such as mines and drilling sites, as well as roads to get these export commodities to ports (Stellenbosch University Centre for Chinese Studies, 2006; Goldstein et al., 2006). (….)
The number of Chinese state-owned and private enterprises in Africa has been estimated at 900 spread across 49 countries (Alden and Rothman, 2006). A study by The Collaboratory shows that Chinese infrastructure investment is largely concentrated in Angola, Nigeria and Sudan and that it involves a wide range of projects, including water and sanitation, transportation, and energy and mineral-related projects. The study also shows that Chinese contractors are now present in just about every single African country. Almost half (49%) of their work stems from international bidding for World Bank and African Development Bank projects, while 40% results from bidding for projects financed by China’s Export-Import Bank. In contrast to European contractors, the Chinese are opening branch offices and moving in to stay. On average, 50% of the labour employed is Chinese and involves mostly management and technical staff. The other half of the workforce, which is largely unskilled, is local. The Chinese have created a very aggressive pricing structure that causes domestic as well as foreign contractors to exit the market.
The Angola Mode
To facilitate its investments abroad, China created the Export- Import Bank (Moss and Rose, 2006). In addition, in 2001 it created Sinosure, an entity that provides export credit insurance. Since then, Chinese activity in Africa has grown rapidly. Many Chinese investments in Africa follow the Angola Mode, an approach to investment under which African nations barter natural resource exports for investment in infrastructure by Chinese firms. The Angola Mode involves securing a senior level cooperation agreement between the Governments of China and the host country. It then requires locating a Chinese contractor willing to take on an infrastructure project and a Chinese resource company willing to make repayments in exchange for oil or mineral rights. China’s Export-Import Bank plays the role of coordinator between the parties and moves payments from the resource company to the contractor. The innovation in this approach is twofold. First, China is bundling ODA-type aid with commercial trade finance in a single transaction. Second, the money from the export-import bank never passes through the host country government; that is, it goes directly to the Chinese contractor. This provides a safeguard against corruption and political instability in the host country and allows China to work in very difficult places (such as Angola and the Democratic Republic of the Congo and Sudan) without concerns of expropriation or freezing of bank accounts.
While this mechanism is new, there is some similarity between the Chinese focus on development assistance to resource-rich countries and United States foreign aid to and oil imports from sub-Saharan countries.
A parallel can also be drawn to Japanese war reparations to its South- East Asian neighbours in the form of Japanese-built ships. Thus, China’s relationship with the African nations, while structured in a slightly new manner, is not a new phenomenon, but rather fits into historical barter arrangements.
See Besada, Wang and Whalley. 2008. China’s Growing Economic Activity in Africa, Cambridge MA, NBER working paper 14024 (Lecture on Trade)

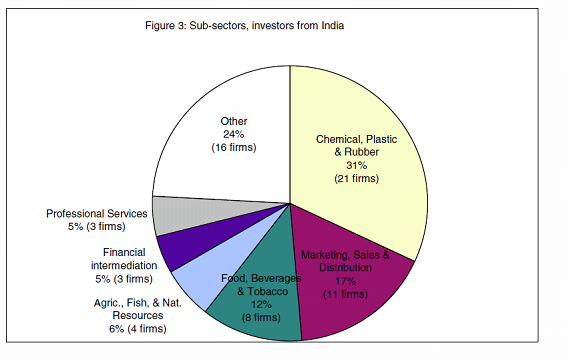
See Henley, Kratzsch, Külür and Tandogan. 2008. Foreign Direct Investment from China, India and South Africa in sub-Saharan Africa: A New or Old Phenomenon?,
Focus on firm-level investments originating from China, India or South Africa in 15 host countries in SSA. Analysis based on a sub-set of firms from the sample of 1,216 foreign-owned firms participating in the UNIDO Africa Foreign Investor Survey (2005). The sample of investments originating from China, India and South Africa is analysed in terms of firm characteristics, past and forecast performance in SSA over 3 years and management’s perception of ongoing business conditions. Comparisons are made with foreign investors from the North.
While investors in SSA from the 3 countries are primarily using their investment to target specific markets, they are operating in different sub-sectors. While there appear to be specific features that firms from a given country of origin share, there are no obvious operating-level features they all share apart from market seeking.
South African FDI most closely matches that of FDI from the North. The most distinctive features of Indian-owned firms operating in SSA are that the overwhelming majority are stand-alone, owner-managed firms and are on average much smaller than Chinese or South African firms
Chinese firms are relatively new arrivals in SSA and are overwhelmingly concentrated in the manufacturing sector, particularly the garments and textile sub-sectors. They are significantly more export-oriented than investors from India and South Africa. About half of Chinese firms are owner-managed operations and half are subsidiaries of small TNCs with global sales of less than US$200 million. They are significantly more widely dispersed across SSA than firms from India and South Africa, perhaps reflecting their relatively weak business and cultural links to the region. It may also reflect the influence of the Chinese authorities on the outward foreign investment decisions of Chinese TNCs where the state is a majority shareholder in the parent company (UNCTAD, WIR, 2006)


See http://www.pambazuka.org/en/category/africa_china/51959. China announces $586bn investment programme, Stephen Marks and Sanusha Naidu (2008-11-13)
The stimulus package is geared towards injecting capital into the domestic economy, particularly within the services sector. But some are hoping that it will also anchor China’s demand for Africa’s commodities. Of course, the volatile oil market also has energy pundits thinking that this could be a boost for the price of the black gold. The fact that the stimulus package is intended to strengthen domestic demand and fuel greater infrastructure development could well mean that China’s African interests are not at risk and instead offer greater opportunities
The recent visit by the Chairman of the Standing Committee of China’s National People’s Congress, Mr. Wu Banggao, could be seen in this light. Invited by five African countries, Mr. Wu reaffirmed relations with the five countries that invited him (Algeria, Ethiopia, Gabon, Madagascar and Seychelles) and concluded further deals with them. In Algeria the Hong Kong listed company Great Wall Motors has entered into a deal to ship 700 luxury vehicles to the North African country. With domestic demand taking a dip, this contract could help ease some of the negative effects for the car maker. In other developments Mr. Wu discussed boosting cooperation with Madagascar, signed an economic and technical pact with Gabon that will see further large-scale projects in mineral production, power production and a gymnasium construction, and proposed a three point plan for co-operation with Ethiopia.
China and Africa Running on the same range Oct 26th 2007. From Economist.com A bank deal brings the pair closer. China’ strengthening ties to Africa were ambitiously tightened on Thursday October 25th. South Africa’s Standard Bank, the largest banking group in Africa by assets, announced that it was hooking up with the Industrial and Commercial Bank of China (ICBC) in a transaction worth a whopping 36.7 billion rand ($5.5 billion). ICBC, the most valuable bank in the world, is worth some $319 billion. It will take a 20% stake in its Johannesburg-based counterpart. Half the shares will be bought from existing shareholders at a 30% premium over market price, and the rest will be new capital. But a takeover is not on the cards: ICBC’s investment is capped at 20%.
The deal is one of superlatives. This is the largest foreign investment by a Chinese bank anywhere in the world. And the deal trumps the 2005 takeover by Britain’s Barclay’s of Absa, another South African bank, to become the largest foreign-direct investment in South Africa. Goldman Sachs was behind the matchmaking. The Chinese bank is keen to spread its wings abroad, especially in Africa; Standard Bank needs cash to feed its own expansion.
(..)The transaction is the latest example of China’s growing interest in the region. It also illustrates the expanding web of trade and investment that links together emerging markets and their growing weight in the world’s economy.
African countries had generally looked north to Europe for investment. But China’s links to Africa date back to the 1950s and 1960s. China’s communist rulers were keen to support Africa’s newly independent countries. Its insatiable appetite for commodities has revived China’s interest in the region. Now commercial considerations rather than ideological ones are the driving motivation for China, which wants the oil, metals, wood and cotton that Africa has in abundance, to feed its soaring economy.
Chinese government officials regularly waltz across Africa in an effort to encourage and support Chinese companies that want to do business in the region. (..)Although Europe and America remain Africa’s largest trading partners, China’s share is growing fast. African exports to China have expanded by over 40% a year since 2001, and imports from China quadrupled over the same period. Total trade reached $50 billion last year and is expected to double by 2010.
China has become an attractive source of cash for Africa. It comes with fewer strings attached than money from the West. Multi-billion dollar lines of credit or investments have been arranged in places like Congo and Angola, now the largest single supplier of oil to China. Africa’s private sector may now join the party as well: more transactions like the on between Standard Bank and ICBC could be on the way. Other South African companies, such as Anglo American, a mining conglomerate, and SABMiller, a giant brewer, moved their listings to the London Stock Exchange to finance foreign expansion. But this is not something that interests Standard Bank.
(..)The growing trade and financial links between China and Africa is what Standard Bank and ICBC want to tap into. No doubt many of ICBC’ s 2.5m corporate clients, which include some large state-owned companies, are keen to do more business in Africa. ICBC will get access to Standard Bank’s extensive banking network in 18 countries across the continent—not to mention its expertise in commodities. The South African bank, which has a small presence in China, now expects to operate in the Chinese market more easily. Both banks are keen to join forces to expand their presence in other emerging markets as well. They are also planning to create a common $500m fund to invest in oil and mining.
Chinese interest in Africa is unlikely to cool at any time soon. The latest deal is a landmark and could provide a template for many more to come.
4. Important players regarding FDI: transnational corporations
- Increasing influence of transnational corporations (TNCs) or multinational enterprises (MNEs)
See Barba Navaretti and Venables 2004 (Venables website) for a complete review of the issues related to MNEs and FDIs.
Barba Navaretti and Venables definition: MNEs are firms that own a significant equity share (50% or more) of another company (the subsidiary or affiliate) operating in a foreign country.
UNCTAD WIR definition of TNCs (see WIR 2004).
Transnational corporations=incorporated or unincorporated enterprises comprising parent enterprises and their foreign affiliates. A parent enterprise is defined as an enterprise that controls assets of other entities in countries other than its home country, usually by owning a certain equity capital stake. An equity capital stake of 10% or more of the ordinary shares or voting power for an incorporated enterprise, or its equivalent for an unincorporated enterprise, is normally considered as the threshold for the control of assets. A foreign affiliate is an incorporated or unincorporated enterprise in which an investor, who is a resident in another economy, owns a stake that permits a lasting interest in the management of that enterprise (an equity stake of 10% for an incorporated enterprise, or its equivalent for an unincorporated enterprise).
Subsidiary enterprises, associate enterprises and branches= all referred to as foreign affiliates or affiliates
Foreign affiliates account for 1/10th of world GDP and 1/3 of world exports. US companies= top spot as sources of investment.
Factors of the steady growth of the multinationals: global push towards privatisation and technological change = long term trends (see UNCTAD WIR 2002)
UNCTAD WIR 2008


· See UNCTAD Investment Brief, n° 5 2006
The 25 most-favoured locations of the largest 100 TNCs in the world and from developing economies in 2005
TNCs from all countries TNCs from developing economies
Host economy | Location intensity | Host economy | Location intensity |
United States | 92.0 | United States | 50.0 |
United Kingdom | 91.0 | HongKong China | 33.9 |
Netherlands | 89.6 | United Kingdom | 33.7 |
Germany | 87.4 | China | 30.0 |
France | 83.5 | Singapore | 26.4 |
Italy | 81.4 | Netherlands | 25.0 |
Brazil | 81.0 | Japan | 22.5 |
Belgium | 80.0 | Malaysia | 20.3 |
Switzerland | 79.4 | Canada | 16.2 |
Mexico | 78.0 | Australia | 15.0 |
Canada | 77.3 | Germany | 15.0 |
Spain | 76.4 | Cayman Islands | 13.7 |
Singapore | 73.7 | TaiwanProvinceofChina | 13.2 |
Poland | 72.0 | Virgin Islands(UK) | 12.5 |
Japan | 70.3 | Bermuda | 11.2 |
Czech Republic | 70.0 | France | 11.2 |
Australia | 69.7 | Brazil | 10.4 |
Argentina | 68.0 | Belgium | 10.0 |
China | 66.0 | Mexico | 9.5 |
HongKong China | 65.6 | Poland | 8.8 |
Austria | 64.0 | Czech Republic | 7.5 |
Portugal | 64.0 | Italy | 7.5 |
Denmark | 61.0 | Spain | 7.5 |
Finland | 55.1 | Korea Republic of | 6.7 |
Hungary | 55.0 | Austria | 6.2 |
Source: UNCTAD. based on Dun and Bradstreet's Who Owns Whom database. Note: Location intensity is defined as the total number of TNCs having at least one affiliate in the host country, divided by 100 minus the number of TNCs from this country listed in the top 100 lists.
· For a review of the determinants of TNCs decisions, see Blonigen 2005. A Review of the Empirical Literature on FDI Determinants: on the FDI decisions of MNEs and the resulting aggregate location of FDI across the world.
Factors affecting MNE decisions: 1) Firm characteristics
2) External factors affecting FDI decisions and location: exchange rate effects; taxes; quality of institutions; trade protection; trade effects, i.e. FDI is as a substitute for exports to a host country.
- Geography of TNCs.
See Shatz and Venables 2000. The Geography of International Investment Increasing importance of multinationals in the world economy
In the mid-1990s 66% of total US exports were undertaken by multinational firms, and 45% of these exports went directly to affiliate companies. The overseas production of US affiliates is 3 times larger than US exports.
The ratio of FDI inflows to GDP stable for developed countries, around 0.9% of GDP. For developing and transition countries, this ratio has increased from 0.8% in the late 1980s to 1.9% in the mid-1990s.
Adjusting for market size, a large share of investment stays close to home, and adjusting for distance, a large share of investment heads towards the countries with the largest markets.
FDI more geographically concentrated than either exports or production. US affiliate production in Europe is 7 times larger than US exports to Europe=this ratio drops to 4 for developed countries as a whole and to 1.6 for developing countries.
àMultinational activity in high income countries=overwhelmingly ‘horizontal’, involving production for sale to the host country market.
àIn developing countries, a higher proportion of activity = ‘vertical’, involving manufacture of intermediate stages of the production process=only 4% of US affiliate production in the EU sold back to the US. For developing countries: 18%, rising to 40% for Mexico. 10% of Japan’s affiliate production in the EU sold back to Japan, compared to more than 20% in developing countries.
For Shatz and Venables 2000, there are 2 types of theoretical models, which correspond to 2 forms of multinational activity.
- Models of horizontal activity: the decision to go multinational =a trade-off between the additional fixed costs involved in setting up a new plant, and the saving in variable costs (transport costs and tariffs) on exports.
- Models of vertical activity: direct investment motivated by factor cost differences.
Tariffs and transport costs both encourage vertical multinational activity, by magnifying factor price differences, and discourage it, by making trade between the headquarters and the affiliate more expensive.
Both types of models suggest concentration of multinational activity.
The major outward investors have much of their horizontal investment in large markets. For the US=Europe. For Japan and Europe=the US. Majority of EU investment stays within the EU. Much of their vertical investment close to their borders, the US in Mexico, the EU in Central and Eastern Europe, and Japan in Asia.
For those interested, see Laura Alfaro and Andrew Charlton. 2007. Intra-Industry Foreign Direct Investment, London, CEP Discussion Paper 825, October: data set on 650,000 multinational subsidiaries. Most FDI occurs between rich countries. The share of vertical FDI (subsidiaries which provide inputs to their parent firms) is larger than thought, even within developed countries. More than half of all vertical subsidiaries are only observable at the four-digit level because the inputs they are supplying are so proximate to their parent firms’ final good that they appear identical at the two-digit level =‘intra-industry’ vertical FDI, different to the inter-industry vertical FDI visible at the two-digit level.
These subsidiaries are not explained by the comparative advantage of traditional models, where firms locate their low skill production stages abroad in low skill countries to take advantage of factor cost differences: multinationals tend to own the stages of production proximate to their final production giving rise to a class of high-skill intra-industry vertical FDI.
· Beneficial effects of TNCs?
On the demand side, FDI stimulate demand for more-skilled workers in host countries
àseveral channels=within multinationals themselves? through knowledge spillovers to domestic firms?
See Slaughter 2002. Does Inward Foreign Direct Investment Contribute to Skill Upgrading in Developing Countries?: robust positive correlation between skill upgrading and the presence of affiliates of U.S. multinationals, with this correlation stronger among the sub-sample of developing countries=inward FDI stimulate skill upgrading in developing countries.
TNCs create backward and forward linkages, if high communication costs with the HQ, if the home and host countries are not too different in terms of use of intermediate goods.
· But otherwise effects may be negative, when creation of enclave economies in the host countries:
See Rodriguez-Clare 1996 on multinationals: linkages affects of multinationals on the host country are subjected to conditions, e.g. when MNEs use intensively intermediate goods, and when host countries and home countries are not too different in terms of intermediate goods produced, and if high costs of communication between HQ and production plants:
Otherwise, risks that MNEs = enclave economies.
5. A key theoretical debate: the effects of FDI – effects on growth, and other effects
- A key debate: the relationship between FDIs and growth: it remains hotly debated.
This relationship is usually said to be positive.
Positive effects of FDI on growth=positive spillovers from FDI
But no consensus on the determinants: market size, infrastructure, political stability, free trade zones seem causal factors, but less clear for business climate, trade openness, fiscal incentives, labour costs: see Lim 2001 for a review of the literature.
So different conclusions are possible: FDI as key factors of economic growth or FDI as negative for countries’ development.
The diversity of views is compounded by the evolution of the nature of FDI, e.g., the increase of FDI in the service sector since the 1990s. In host countries, FDI provides capital, complements domestic private investment, creates job opportunities and facilitates technology transfer.
· For a review of the possible relationships, see Chowdhury and Mavrotas. 2006. FDI and Growth: What Causes What? Neoclassical models of growth and endogenous growth models = the basis for most of the empirical work on the FDI-growth relationship.
The direction of causality between growth and FDI is a matter of debate.
4 possible channels for this relationship growth-FDI:
= via the determinants of growth, the determinants of FDI, the role of multinational firms in host countries, and the direction of causality.
It is GDP that causes FDI in some countries (e.g., Chile) and not the opposite. In other countries, such as Malaysia and Thailand, there is a bi-directional causality between growth and FDI.
· Effects of FDI on the attraction of productive inflows of capital?
See Greenaway, Sapsford and Pfaffenzeller. 2007. Foreign Direct Investment, Economic Performance and Trade Liberalisation: there are arguments and supporting evidence indicating that export-promoting trade and investment strategies attract more and more productive inflows of foreign capital than do import-substituting strategies. These findings are robust.
FDI inflows exert no significant influence upon income growth in closed economies, but FDI inflows exerted a statistically significant positive influence for the open economies. While inflows of FDI into closed economies exerted no discernible impact on host country economic growth performance, FDI inflows into open economies exert a positive and statistically significant influence. FDI inflows act as an engine of late twentieth-century growth in open economies, but not in closed ones.
· A matter of debate: issues of endogeneity
Does a low level of investment =>low level of growth?: on investment, and not specifically on FDI, see Devarajan, Easterly and Pack, 2003, Low Investment is not the Constraint on African Development: investment is endogenous, but the low level of investment is not the explanation of the slow growth in SSA: rather low productivity, explained itself nit by a single factor but by a combination of factors – e.g., poor policies, under-utilisation of capacity)
· However, the relationship FDI-growth remains debated
Issue of methodologies: e.g., cross-country, panel, time series.
See Herzer, Klasen and Nowak-Lehmann Danziger. 2006. In Search of FDI-Led Growth In Developing Countries: belief that FDI generally has a positive impact on economic growth in developing countries. But limitations of the existing literature on FDI-led growth hypothesis
28 developing countries using cointegration techniques on a country-by-country basis. Findings: in the vast majority of countries FDI has no statistically significant long-run impact on growth. In very few cases, FDI indeed contributes to economic growth both in the long and the short run.
But for some countries, evidence of growth-limiting effects of FDI in the short or long term.
+no clear association between the growth impact of FDI and the level of per capita income, the level of education, the degree of openness, and the level of financial market development in developing countries.

From Herzer et al. 2006.
- There are direct and indirect channels of the impact of FDI on development:
Example of employment and training: effects of FDI on employment normally higher in greenfield FDI, M&As often lead to labour shedding. See the works of Sanjaya Lall: employment effect is higher within export-oriented regimes with abundant, cheap labour. Benefits= technology transfers; promotion of trade and exports, linkages of TNCs and local firms.
See Lall and Narula 2004 Foreign Direct Investment and its Role in Economic Development: Despite globalisation, the role of FDI in development has not changed, but dynamics of FDI-assisted development have changed = greater variation in the kinds of FDI, the benefits each offers, and the manner in which each interacts with the host economy: role of multinational enterprises (MNEs) in industrial development in a ‘learning system’ perspective +policy tools available for using FDI for development in the context of the WTO.
See Markusen, Rutherford and Tarr. 2005. Trade and Direct Investment in Producer Services and the Domestic Market for Expertise: FDI is beneficial to host countries not only because it allows for new knowledge and competition, but also because FDI in services may help host countries to produce and export more advanced products.
See Borensztein, De Gregorio and Lee. 1998. How Does FDI Affect Economic Growth?: cross-country regression on FDI flows from industrial countries to 69 developing countries, last two decades: FDI fosters the transfer of technology and contribute relatively more to growth than domestic investment.
But the higher productivity of FDI holds only when the host country has a minimum threshold stock of human capital. The positive impact of FDI on growth depends on the availability of a sufficient absorptive capability of the advanced technologies.
· FDI create spillover effects into host countries.
But limitations of these spillovers effects, depending on the stock of human capital, the interest in local firms of promoting skills transfer and the competition environment: see the review of the literature in Blomström and Kokko 2002, FDI And Human Capital: A Research Agenda, OECD)
- FDI spillover effects through backward linkages?
=positive correlation between productivity growth of domestic firms and multinationals in downstream sectors =knowledge spillovers from foreign affiliates to their local suppliers + result of increased competition in upstream sectors (see on a non-SSA example, Lithuania, see Smarzynska, 2002, Does Foreign Direct Investment Increase the Productivity of Domestic Firms, WB)
But: specificity of LDCs: weak absorptive capacities and coordination failureà may limit the leveraging of FDI for industrial upgrading.
· FDI fosters domestic investment and employment:
See Ndikumana and Verick. 2008. The Linkages between FDI and Domestic Investment: Unravelling the Developmental Impact of Foreign Investment in SSA: recent increase in FDI to SSA: but impact on development?
Key channel of the impact of FDI on development is through its effects on domestic factor markets, especially domestic investment and employment.
= two-way linkages between FDI and domestic investment in SSA.
Findings: 1) FDI crowds in domestic investment; 2) countries will gain much from measures aimed at improving the domestic investment climate.


From Ndikumana and Verick 2008
- FDI have positive effects on domestic firms’ productivity and on their levels of exports.
FDI can promote the development of local industry.
FDI affect local firms: competition in the product and factor markets reduce profits of local firms, but linkage effects to suppliers industries reduce input costs and raise profitsàFDI may be complementary to local industry.
Ex. of Taiwan: FDI created demand from local suppliers, raising quality, productivity and product diversity: see Markusen and Venables, 1997. FDI as a Catalyst for Industrial Development
FDI are desirable because they induce positive externalities generated by the foreign affiliates, e.g. knowledge externalities, to generate productivity spillovers between foreign affiliates and local suppliers.
Investment is a factor of growth, though not sufficient: in SSA other factors of growth or lack of growth. FDI allows the transfer of technology: new varieties of capital inputs, that cannot be achieved through financial investments or trade in goods and services.
FDI promote competition in the domestic input market. Recipients of FDI often gain employee training, which contributes to human capital development.
Profits generated by FDI contribute to corporate tax revenues in the host country. However, competition for attracting FDI may induce cuts in corporate tax rates.
Impact of FDI on growth: either overall effect (on growth or net welfare) or FDI specific impact on employment, technology, trade and so on.
Many econometric analyses relating FDI stocks and/or flows to host country rates of growth à positive overall impact.
But analysis of the net social welfare effects of FDI=the opposite conclusion: a substantial portion of foreign investments in developing countries had negative net social effects on their host economies.
Standard theory: firms in countries with lower barriers to trade and to investment competition enjoy higher productivity of investment, both foreign and domestic, and more rapid growth.
- See the series of WB RPED (Regional program for enterprise development) surveys in SSA:
E.g., see Ramachandran and Shah 1998 on Zimbabwe, Ghana and Kenya: on the effect of foreign ownership on value added of industrial firms in SSA.
Econometric analysis: foreign ownership has a significant effect on value added only when it exceeds a majority share=majority ownership creates appropriate incentives and provides opportunity to raise firm-level value added.
· However, the evidence for these spillover effects is mixed
See the review by Görg and Greenaway. 2004. ‘Much Ado About Nothing? Do Domestic Firms Really Benefit from FDI?’: Governments try to attract inward investment, expecting spillover benefits to augment the primary benefits of a boost to national income from new investment.
Review of the sources of FDI induced spillovers, and evaluation of the empirical evidence on productivity, wages and exports spillovers in developing, developed and transitional economies. Theory can identify a range of possible spillover channels, but robust empirical support for positive spillovers is, at best, mixed.
Table 1: Potential channels for spillover from FDI
Driver Sources of Productivity Gain
Imitation Adoption of new production methods.
Adoption of new management practices.
Skills acquisition Increased productivity of complementary labour.
Tacit knowledge
Competition Reduction in X-inefficiency.
Faster adoption of new technology.
Exports Scale economies.
Exposure to technology frontier.
There can even be negative or neutral effects: foreign firms can reduce the productivity of domestic firms through competition effects,
In addition, there may be lags to domestic firms’ learning from multinationals. Secondly, MNEs may guard their firm specific advantages closely to prevent leakages to domestic firms and, therefore, no spillovers occur.
Thirdly, positive spillovers may only affect a sub-set of firms and aggregate studies, therefore, underestimate the true significance of such effects.
Fourthly, spillovers do not occur horizontally (i.e., intra-industry) but through vertical relationships which are missed in conventional spillover studies:
= problems of absorptive capacity, importance of vertical linkages.
Many studies do not find these positive spillover effects of FDI: for those interested, see Roger Albertus Smeets. 2008. Collecting the Pieces of the FDI Knowledge Spillovers Puzzle "World Bank Research Observer, vol. 23, n°2, pp. 107-138:. Recent surveys of the empirical literature have concluded that the evidence is mixed on the magnitude, direction, and even existence of knowledge spillovers from FDI.
For those interested, there is a case study by Waldkirch, Andreas and Ofosu, Andra. 2008. Foreign Presence, Spillovers, and Productivity: Evidence from Ghana: http://d.repec.org/n?u=RePEc:pra:mprapa:8577&r=dev: on the the effect of foreign presence on the productivity of manufacturing industries in Ghana, using firm level panel data: robust evidence that the presence of foreign firms in a sector has a negative effect on domestically owned, but a positive effect on most foreign owned firms. Unlike in recent work on China, it does not appear that the negative level effect is compensated for by a positive growth effect. This finding underscores that care must be exercised in extrapolating results from one country to others.
- Role of policies: indeed the developmental impact of FDI in the host country is not automatic:
But depends on various policy tools, e.g. ‘host country operational measures’= local content requirements, requirements/export performance or employment performance, /transfer of technology, and so on: see UNCTAD. 2003. The Development Dimension of FDI: Policy and Rule-making Perspectives.
For the WB, typically, the role of policies is crucial for FDI: A WB view: see Lumbila (2005), What Makes FDI Work? A Panel Analysis of the Growth Effect of FDI in Africa: panel analysis of the effects of FDI on growth; data from 47 SSA countries over 1980–2000.
=FDI exerts a positive impact on growth in SSA
+ factors such as trained human capital and an attractive investment climate stemming from a developed infrastructure, lower country risk, stable macro environment in the host countries, enhance the impact of FDI on growth.
Domestic and foreign investment are effective and growth enhancing only in a good policy environment. But SSA receives only a small portion of FDI, so foreign aid and domestic investment still account for a greater effect on growth.
Corruption does not matter in the case of FDI: countries where corruption is perceived to be high still benefit from a positive impact of FDI on growth.
6. The other important theoretical debate: the determinants of FDI
- Global market failure underlying the geographical concentration of FDI in the richest countries, not the poor ones, which are the most needy.
Highlighted by R. Lucas (1990) (“why capital does not flow to poor countries?”). Although SSA investment often offers high returns.
- At a micro level, there are several motives of firms to invest across national borders. See the definitions of UNCTAD, WIR Report 1998, and Odenthal 2001.
1) Market-seeking investments, to access new markets that are attractive due to their size, growth or a combination of both.
2) Efficiency-seeking investments: aim at taking advantage of cost-efficient production conditions at a certain location. Important factors=the cost and productivity levels of the local workforce, the cost and quality of infrastructure services (transport, telecommunication), and the administrative costs of doing business (resources needed in terms of finance and time to deal with government institutions)àsectors where products are produced for regional and global markets, competition based on price (e.g., textiles and garments, electronic or electrical equipment, etc) and not on quality differentiation.
3) Natural-resource seeking investment to exploit endowments of natural resources. The production and extraction of these resources is bound to the location of the resources. However, given that most resources can be found in a relatively large number of locations, companies usually choose on the basis of differences in production cost and conditions in different locations.
4) Strategic-asset seeking investment, oriented towards man-made assets, as embodied in a highly-qualified and specialised workforce, brand names, shares in particular markets, etc. Increasingly, such FDI are cross-border mergers and acquisitions, whereby a foreign firm takes over the entire or part of a domestic company that is in possession of such assets.
For those interested, see S. Ibi Ajayi, 2006, FDI and Economic Development In Africa Paper for presentation at the ADB/AERC International Conference on Accelerating Africa’s Development Five years into the Twenty-First Century, Tunis, Tunisia November 22-24, 2006.
In the literature, usual determinants refer to governance failures, problems of policy credibility, macroeconomic policy failures, and poor liberalisation policies etc.: they deter FDI flows. For SSA, see Ajayi, S. Ibi (2004). The Determinants of Foreign Direct Investment in Africa: A Survey of the Evidences, Paper presented at the IMF/AERC Special Workshop on the determinants of Foreign Direct Investment in Africa. December 2-3, Nairobi, Kenya: he identifies the following determinants:
Ø Size of the market and growth
Ø Costs and skill of the labour force
Ø Availability of good infrastructure
Ø Country risk
Ø Openness of the economy
Ø Institutional environment
Ø Availability of natural resources
Ø Concentration of other investors (agglomeration effects)
Ø Return on investment
Ø Enforceability of contracts & transparency of the judicial system
Ø Macroeconomic stability
Ø Availability of “sweetener” policies.
- FDI express a trade off within foreign firms, which diverge from host countries governments
See Mattoo, Olarreaga, Saggi, Mode of Foreign Entry, Technology Transfer, and FDI Policy, WB 2001= choice between FDI as direct entry of foreign firms or acquisition of existing domestic firms. Preferences of foreign firms may diverge from host country government and host country domestic welfare over the two modes of FDI if costly technology transfer.
The trade-off between technology transfer and market competition= key determinant of preferences. If high technology costs, foreign firms prefer direct entry but governments may prefer acquisition because larger transfer of technology
àdomestic welfare can be improved by restrictions on FDI inducing foreign firms to choose the socially preferred mode of entry.
- At a macro level: growth is a positive factor of FDI
= FDI growth as an effect of an increase in growth rates?
See Calderon, Loayza and Serven 2004 Greenfield Foreign Direct Investment and Mergers and Acquisitions: in the 1990s, at a global level, rise in FDI volume accompanied by a marked change in its composition: acquisition of existing assets (M&A) grew much more rapidly than investment in new assets (‘greenfield’ FDI), e.g., countries undertaking extensive privatisation of public enterprises.
àeconometric analysis, 72 countries, 1987-2001: both types of FDI lead domestic investment, but not the reverse. + both types FDI do not precede economic growth in either developing or industrial countries, but FDI does respond positively to increases in the growth rate.
Causality=GDP leading to FDI, not vice versa.
See Akinkugbe 2003 Flow of FDI to Hitherto Neglected Developing Countries: increases in the flow of FDI to the developing countries in the last decade, but uneven inflow =middle-income developing countries have benefited, not the lower-income countries.
Econometric approachà factors that explain the volume of FDI= high per capita income, high outward-orientation, high level of infrastructure development, high rate of return on investment=explain investors’ decisions (
- The role of trade in fostering FDI
Trade liberalisation fosters inward investment: trade and FDI are complements + skilled labour force= a factor of attraction of FDI. Possible low-equilibrium traps: lack of human capital has a negative impact on FDI and lack of FDI has a negative impact on the incentives to acquire education (for those interested, arguments developed by Faini, Riccardo. 2004. Trade Liberalization in a Globalizing World, London, CEPR discussion paper 4665.)
Role of trade openness: see Kandiero and Chitiga 2003, Trade Openness and FDI in Africa: SSA global share of FDI has lagged behind other regions in the world, despite the sharp increase in FDI inflows to the region in 2001.
Factors: e.g., perception of high corruption, weak governance, poor infrastructure.
Impact on FDI of trade openness in manufactured goods, primary commodities and services; cross-country data, SSA countries, four periods: 1980-1985, 1985-1990, 1990-1995 and 1995-2001 = FDI to GDP ratio responds well to increased openness in the whole economy and in the services sector.
Poor infrastructure, openness to trade impact on the FDI inflow to SSA in manufactured goods, primary commodities and services.
· Openness to FDI attracts FDI
See Agosin and Machado. 2007. Openness and the International Allocation of FDI:
They devise an ordinal index to measure the openness of FDI policy regimes:

Findings: at a global level, there has been a generalised increase in the degree of openness to FDI in the world between 1990 and 2002.
Whereas openness to FDI is positively associated with FDI flows, the most important determinants of variations in FDI flows across countries and over time are country size, the level of educational achievement, and growth. Liberalizing approval procedures and lifting requirements that foreign companies enter into joint ventures with domestic firms are the most important components of a liberalisation policy that encourage FDI.
+ openness of the FDI regime operates as a factor enabling FDI,
but key role of location advantages in determining the international allocation of FDI.
+ countries with lower levels of education and larger domestic markets are associated with greater restrictions on FDI.
· For the IMF/WB, typically, ‘good policies’ and market-related determinants attract FDI
= political and macroeconomic stability, firm commitment to economic reform, sound monetary and fiscal policies, appropriate exchange rate policies, no impediment to private sector activities, trade openness, export-oriented trade strategies, open policies to international flows of services and knowledge.
Same determinants as for local investors. Government and firms may have different preferences for a particular form of FDI, e. g technology transfers or market competition.
FDI= not only to mining and oil: e.g. privatisation. But SSA do not attract manufacturing investment that provide technology, skills and market access: see Pigato 2000. Foreign Direct Investment in Africa.
For the WB, there are some successes: e.g., Mali or Mozambique (see Morisset nd)
In this perspective, policies are the key issue:
à positive impact of FDI if macroeconomic stability, efficient institutions, political stability, ‘good regulatory framework’: FDI to SSA not solely driven by natural resource endowment, governments play an important role in FDI: see Asiedu 2005, 2006 Foreign Direct Investment in Africa: The Role of Natural Resources, Market Size, Government Policy, Institutions and Political Instability.
· In the same vein, macroeconomic instability, investment restrictions, corruption and political instability have a negative impact on FDI to SSA
See Asiedu 2005, 2006, FDI in Africa: The Role of Natural Resources, Market Size:. panel data for 22 countries, period 1984-2000: impact of natural resources, market size, government policies, political instability and the quality of the host country’s institutions on FDI
+ importance of natural resources and market size vis-à-vis government policy and the host country’s institutions in directing FDI flows.
Natural resources and large markets promote FDI.
Lower inflation, good infrastructure, an educated population, openness to FDI, less corruption, political stability, reliable legal system: similar effect.
A decline in the corruption from the level of Nigeria to that of South Africa has the same positive effect on FDI as increasing the share of fuels and minerals in total exports by about 35%
Small countries or lacking natural resources can attract FDI by improving their institutions and policy environment.
See Ndikumana 2003 Capital Flows, Capital Account Regimes and Foreign Exchange Regimes in Africa: constraints on FDI in SSA: weak macroeconomic policies, regulatory framework, underdeveloped financial systems, high country risk
- Monetary and exchange rate policies:
See Rogoff and Reinhart 2003 IMF FDI to Africa: the Role of Price Stability and Currency Instability.
Monetary and exchange rate policies explain the poor attraction of FDI in SSA: especially the incidence of inflationary episodes and currency crashes. Monetary policy goes from very transparent to very opaque.
SSA dual and parallel markets=parallel market premia are an indicator of the degree of distortions and extent of transparency. SSA stands apart from other regions in this measure of transparency.

- The importance of uncertainty as a determinant of FDI.
For those interested, a well-known paper: see Fernandez and Rodrik 1991 Resistance to Reform: Status Quo Bias in the Presence of Individual-Specific Uncertainty, American Economic Review, vol. 81, n°5, December, pp. 1146-1155.
Issue of risk as a key constraint on FDI in SSA: high premia, high uncertainty, where investors prefer the status quo.
See Lensink and Morrissey. 2001 FDI: Flows, Volatility and Growth: FDI has a positive effect on growth, whatever the level of human capital, but volatility of FDI has a negative impact= not the volatility of FDI per se but volatility as it reflects political and economic uncertainty.
See UNCTAD 2005, Economic Development in Africa: Rethinking the Role of FDI. According to UNCTAD 2005, for the WB, there is a contrast between relatively high returns on FDI in SSA and the persistently low level of actual flows: the potential rewards awaiting SSA if it improves its governance image in the eyes of international business.
For those interested, for a view from the IFIs, see Paul Collier and Patillo, 1999 Investment and Risk in Africa. London: Macmillan: a key determinant explaining the profile of FDI in SSA is the perception by investors of SSA as a highly risky region.
Cf the OECD view: the ‘spectacular failure’ of SSA countries to attract FDI due to unsustainable national economic policies, poor-quality services, closed trade regimes, and weak political legitimacy, thus advice to governments to redesign their macroeconomic, trade and industrial policies to attract FDI.
Many analyses in terms of risk: some SSA countries viewed as particularly risky.
Operational risk ratings More bad news Oct 13th 2008. From Economist.com Global business profitability is still on the wane

Risk Briefing rates operational risk in 150 markets on a scale of 0-100. The overall scores are an aggregate of underlying scores for ten categories of risk: security; political stability; government effectiveness; legal and regulatory; macroeconomic; foreign trade and payments; financial; tax policy; labour market; and infrastructure.
Operational risk ratings Watch your step Aug 12th 2008 From Economist.com. Prospects for business profitability have worsened slightly in Britain and France

See The Economist.com, Aug 22nd 2007

- Among important determinants of FDI: the presence of natural resources, initial conditions, locational advantages, e.g., proximity with important markets: see Basu and Srinivasan 2002 Foreign Direct Investment in Africa: Some Case Studies.
Particularly strong geographical disadvantages (e.g. transportation) in landlocked countries (see UNCTAD 2003 on FDI in landlocked developing countries).
- Human capital and local skills: increasingly viewed as key determinants of FDI, more in the 1980s-90s than before
Human capital also makes that host countries gain maximum benefits from FDI.
= TNCs increasingly more interested by skills than natural resources and lower-end manufacturing and cheap labour as in the 1960s-70s: see Noorbakhsh et al. 2001 Human Capital and FDI Inflows to Developing Countries: New Empirical Evidence: over 1980s-mid-1990s, both the stock and flow measures of the human capital variable show statistically significant and positive effects on FDI inflows + effects more significant over time.
· TNCs in developing countries during the late 1980s and 1990s: efficiency-seeking and/or subcontracting.
See Dunning, 2002, Determinants of Foreign Direct Investment: Globalization Induced Changes and the Role of FDI Policies: globalisation has changed the locational determinants of FDI. The geography of FDI is affected by the widening scope of the knowledge based economy and regional integration schemes.
For TNCs, spatially related decisions=what and how much to sub-contract, what and how much to produce, and to whom and where to sell end products= increasingly key component of competitive advantage.
Traditional determinants of FDI = natural resource-seeking and market-seeking, efficiency-seeking and asset augmenting objectives
+ economic, business environment of host countries, and their FDI-related policies;
+the mode of entry or expansion of the FDI (=greenfield FDI, M&As).
But increasingly high skilled labour is viewed as crucial.
In SSA, TNCs are resource-seeking, so human capital apparently less crucial for attracting FDI: but human capital is still an indirect determinant of FDI as it contributes to political stability, another determinant of FDI.
- Regionalism and regional arrangements may be a positive determinant of FDI, as well as EPZs/export processing zones
See the Lecture on intra-trade: many regional agreements include clauses on investment and FDI.
See on the example of SADC countries, Odenthal 2001, FDI in SSA, OECD: but obstacles are access to external non-debt financial resources, and problems of political stability and of legitimacy of political leadership.
Regional arrangements may foster FDI: see Lall. 2005. FDI, AGOA and Manufactured Exports by a Landlocked, Least Developed African Economy: Lesotho. Lesotho as SSA largest exporter of apparel to the US. Its performance relies heavily on Asian investors and trade privileges.
But apparel production suffers from low productivity, poor skills and weak local links. Its prospects after AGOA (African Growth and Opportunities Act) remain uncertain.
See UNCTAD World Investment Report/WIR 2006: Poor infrastructure and a lack of skilled workers, coupled with the ending in 2005 of the quotas established under the Multi-Fibre Arrangement (MFA), contributed to some divestment in the ready-made garments industry in countries like Lesotho:
=preferential market access (as provided by the US AGOA and the EU’s Everything But Arms initiative/EBA is not in itself sufficient to attract and retain manufacturing FDI in a globalising environment.
From UNCTAD WIR 2003

- Determinants of FDI are not only absolute but relative to other regions àone must distinguish the absolute from the relative terms
àin SSA, improvements in infrastructure or institutions, liberalisation of the regulatory framework, but SSA share of FDI in developing countries continues to deteriorate
Reforms depth in SSA is relatively weaker than the reforms implemented in other developing countries: relative to other regions, SSA is less attractive for FDI.
Global competition is not enough to improve one country policy environment: to be made in absolute and relative terms: see Asiedu 2004 on policy reform and FDI

From Basu and Srinivasan 2002

From Rogoff and Reinhart 2003
- Corruption: often highlighted by the IMF/WB: corruption deters FDI, e.g. wholly-owned subsidiary.
For those interested, see Smarzynska, Beata K. and Shang-Jin Wei. 1999. Corruption and Composition of Foreign Direct Investment: Firm-Level Evidence, Washington D. C., the World Bank, policy research working paper 2360: corruption increases the value of using a local partner to cut through bureaucracy, but corruption decreases the protection of investor’s assets and lowers the probability of a fair adjudication of disputes between foreign and domestic partners, which reduces the value of having a local partner.
· In the IFI literature, corruption is usually said to deter FDI: but evidence shows this is not the case, especially as FDI are mostly in the natural resources sector.
Growing more corrupt Oct 17th 2008 From The Economist Intelligence Unit ViewsWire. Although Africa's economies are growing, they appear to be getting more corrupt, too. Africa’s economy has grown much faster since 2000, but fears regarding corruption have risen too. Africa’s average score on Transparency International’s Corruptions Perceptions Index has fallen steadily since 2000, reaching a new low of 2.75—out of a possible ten—in 2008. Of the 47 Sub-Saharan countries ranked in the 2008 survey, 64% score less than three out of ten, a level that, according to Transparency International, indicates "rampant corruption". Another 14 scored between three and five, indicating that corruption is perceived as a "serious challenge by country experts and businessmen". Just three states—Botswana, Cape Verde and Mauritius—score above the index's mid-point.
Where available, country comparisons for the past five years give a different—and better—impression. In 13 of the 22 states for which five-year comparable figures are available, corruption perceptions have improved. In one, Malawi, they are unchanged, while in eight countries in the bottom half of the table, the situation has deteriorated.
The biggest gain by far is registered by Nigeria, whose score has risen by 93%, albeit from a very low base. It has moved up 11 places in the world league table to 121 from 132. Only one other African country, Madagascar, has improved its standing, and then only by three places.
The main losers in terms of rankings are Sudan (down 67 places), The Gambia (66 places) and Zimbabwe (60), followed by Congo (Brazzaville) and Sierra Leone, both down 45 places, Ethiopia (down 34), Côte d’Ivoire (33) and Malawi (32). Generally, however, the declines have more to do with the sharp increase in the number of countries ranked, from 132 to 180, than any marked deterioration in perceptions of corruption (not least because many of the states concerned have long been deemed very corrupt).
Southern African states such as Botswana, Mauritius, South Africa and Namibia top the table, while resource-rich nations, especially oil exporters (Sudan, Chad, Equatorial Guinea, Democratic Republic of Congo, Angola, Congo and Nigeria), cluster around the bottom. What this means is that, in recent years especially, economic growth has not been correlated with low levels of corruption.
A comparison of growth in incomes per head since 2003 shows that countries with scores of less than three—defined as "rampant corruption"—have an average annual growth rate of 4.8%. In comparison, the six countries with scores in excess of three achieved growth averaging 4.2% annually over the five years, implying that high levels of corruption are not necessarily bad for economic expansion. This, however, is simplistic, since the high-corruption countries are mostly resource-rich nations, growing rapidly despite graft, not because of it. More importantly, just as most though not all resource-rich countries have been reluctant and slow reformers generally, so too they are more prone to corruption because the rewards are so much greater than in poor, low-income states.
The China factor
It is also significant that China has concentrated its aid and investment in nations such as Angola, the Democratic Republic of Congo, Equatorial Guinea, Nigeria and Sudan, where corruption is (or has been) high. This means that it is no longer possible to argue that corruption deters foreign direct investment. All of which is bad news for reform-minded agencies like the OECD, IMF and World Bank. They will probably seize on Nigeria—an apparently startling example of reduced corruption in Africa—to justify their arguments that low corruption is good for growth and investment, but the regional figures suggest otherwise.
7. Cautious views: positive vs. negative impacts of FDI
· See UNCTAD 2005 on FDI in SSA: FDI carries costs and benefits for the host country
In SSA dependence on commodity exports and deindustrialisation trend following the debt crisis of the early 1980s = danger of recreating a pattern of FDI-led enclave development even if, as has recently been the case in the mining sector, FDI begins to flow to SSA on a larger scale.
Success of the deregulation of the mining sector in attracting FDI in recent years, but a positive developmental impact has failed to materialise.
- FDI supposed to be a safer financing that short term capital flows
Short term capital flows said to lead to financial crises: FDI do not have the ‘explosive’ characteristics of other flows, less exposed to reversal, contagion effects, because large, illiquid assets make disinvestments more difficult: see Fernandez-Arias and Hausmann 2000 Is FDI a Safer Form of Financing?
- FDI not inherently virtuous
FDI may go to notoriously risky countries, e.g., oil countries (Angola, Equatorial Guinea, Nigeria, RDC). High risks, high returns.
Benefits not shared with populations. TNC investment efficiency depends on overall incentive and capability structure. Low FDI efficiency if no capability structures – skills, supplier networks, physical, scientific and institutional infrastructure: see Pigato 2000 Foreign Direct Investment in Africa
Many studies of SSA: limited or even negative impact of FDI during the 1980s, e.g. Cote d’Ivoire or Nigeria: FDI were directed to import substituting firms, the value of imports was calculated to be greater than the value added produced. FDI gave rise to a twofold foreign exchange cost in terms of outflows of investment income and the cost of imported inputs. Other studies: FDI in SSA has made a modest contribution in terms of direct employment generation. However, during the 1970s and 1980s, lack of competition, distort regulatory and incentive framework.
‘Bright side’ and a ‘dark side’ of FDI: see Moran 2002 The Relationship Between Trade, FDI and Development, Seoul, ADB annual Conference: positive cases: incentive structure: it is in the parent’s self-interest to keep the local affiliates at the frontier of best practices in the industry.
But in negative cases, the local affiliates do not achieve full economies of scale, nor utilise the most advanced production techniques, nor achieve the same standards of quality control.
FDI up to 45% in 30 countries had negative welfare implications on the host country.
MNCs can be harmful when tax evasion (by transfer pricing), predatory behaviour against local competition, monopolistic power by raising entry barriers. The negative effects arise not from foreign ownership per se but from the lack of competitiveness of input and output markets in the host country; and from distortions in domestic incentives.
- A high FDI share: a sign of weakness?
See Hausmann and Fernández-Arias 2000: Foreign Direct Investment: Good Cholesterol?: on reasons why a high share of FDI in total capital inflows may be a sign of a host country's weakness rather than its strength: FDI flows share in total inflows is higher in riskier countries.
Same issues discussed in Prakash Loungani and Assaf Razin. 2001. How Beneficial Is Foreign Direct Investment for Developing Countries?, Finance and Development, June, vol. 38, n°2.

- Stability of FDI? FDI reversals are possible.
See Perry and Hausmann, in the IMF-WB Finance and Development / F&D 2001: FDI difficult to move out of the host country on short notice.
But financial transactions can sometimes make a reversal of FDI, e.g. the foreign subsidiary can borrow against its collateral domestically and then lend the money back to the parent company. A significant portion of FDI is intercompany debt, the parent company can quickly recall it.
· FDI may increase financial fragility unless it is adequately regulated by recipient governments
Problem of financial imperfect markets and market failure= FDI use stock markets, which entail risks: speculation, volatility. Asian developmental states rely on bank-based financial systems.
E.g., the timing of FDI, the total amount of FDI, the selection of the large projects of TNCs – one of the issues of controversies in the WTO.
Complete freedom given to TNCs in acquiring local firms may lead to the best developing country corporations acquired by TNCs that are not necessarily more efficient (see Singh 2001 Foreign Direct Investment and International Agreements: a South Perspective).
· For a perspective more on emerging countries, see IMF Survey Magazine, January 29, 2007. Are FDI flows a stabilizing factor during a financial crisis?
FDI flows are generally more stable than portfolio and other investment flows, but not always. A widely shared view is that FDI is a stabilising factor during financial crises in emerging market countries, because FDI is driven by positive longer-term sentiment about the recipient country and, to the extent that it entails physical investment in plant and equipment, is more difficult to reverse than other capital flows: policymakers should encourage such flows to ‘insure’ against sudden reversals of capital flows.
Empirical evidence broadly supports the hypothesis that FDI flows are more stable than all other forms of capital. However, one should not be too quick to infer from aggregate data that the behaviour of direct investment enterprises during crises is necessarily stabilising from the perspective of the balance of payments.
- Are the benefits of FDI sufficient to justify the associated policy interventions?
E.g., do the benefits of FDI justify the financial incentives provided by recipient countries’ governements?
See Blomstrom and Kokko 2003, The Economics of Foreign Direct Investment Incentives: investment incentives for foreign firms are not always efficient way to raise national welfare. Theory= financial subsidies to inward FDIàspillovers of foreign technology and skills to local industry.
But spillover benefits are realised only if local firms are able to invest in absorbing foreign technologies and skillsàso subsidisation of foreign investment beneficial if simultaneous support to learning and investment in local firms.
See the critical views of Hanson 2001 on the issues of taxation of FDI: for small open economies, efficient taxation of foreign and domestic capital depends on their relative mobility.
If foreign and domestic capital are equally mobile internationally: optimal for countries to subject both types of capital to equal tax treatment.
If foreign capital is more mobile internationally, optimal to have lower taxes on capital owned by foreign residents than on capital owned by domestic residents. If no market failure, no justification for favouring FDI over foreign portfolio investment.
Countries tax income from foreign capital at rates lower than those for domestic capital and subject different forms of foreign investment to different tax treatment. FDI=sensitive to host-country characteristics. Higher taxes deter foreign investment.
A more educated work force and larger goods markets attract FDI.
TNCs agglomerate in a manner consistent with location-specific externalities.
Weak evidence that FDI generates positive spillovers for host economies. Multinationals are attracted to high-productivity countries, and to high-productivity industries: little evidence at the firm level that FDI raises the productivity of domestic enterprises. Plants in industries with a larger multinational presence enjoy lower rates of productivity growth over time.
For Hanson, little evidence that promoting FDI is warranted on welfare grounds.
Subsidies to FDI= yes where multinationals are intensive in the use of elastically supplied factors, where the arrival of multinationals does not lower the market share of domestic firms, where FDI generates strong positive productivity spillovers for domestic agents: but first and third conditions are unlikely
- The debate on the effects of FDI of crowding-in/crowding-out of public investment and of private investment
Both effects, crowding-in or crowding out of private investment by public investment: see Agosin and Mayer 2000: FDI crowds in or crowds out domestic investment.
In Asia – but less so in SSA – there has been crowding in of domestic investment by FDI; by contrast, strong crowding out has been the norm in Latin America. The effects of FDI on domestic investment are not always favourable. This reject simplistic policies toward FDI.
See Agosin. 2008. Is Foreign Investment Always Good for Development?: on the effects that FDI can have on domestic investment in recipient developing countries.
On circumstances under which FDI may be expected to induce additional investment from national firms, which is labelled as “crowding in”.
Under other circumstances, FDI may well displace investments that would have been made by domestic firms in the absence of the foreign investor (“crowding out”)
A third possibility: FDI may translate into real investment on a one-to-one basis: “neutral effect”.
FDI over the period 1971 through 2000 has generally had neutral or crowding out effects on domestic investment => a liberal policy toward FDI should be complemented with an effort to ensure that the recipient country attracts those investments that are more likely to maximize their investment rates.

Undoubtedly, a part of FDI will become physical investment. It is very likely that this share will rise with the extent to which FDI is of the greenfield variety rather than M&As. Table 2: a significant proportion of FDI takes the form of acquisition of existing assets, which seems to validate the presumption that not all FDI becomes new capital investment. In the developing world, this share is particularly high in Latin America, where a significant share of FDI has gone into sectors that are particularly suited to M&As, such as telecommunications, energy, water and sanitation. In Asia, on the other hand, the share of M&As is low, because the regional FDI totals in recent years are very influenced by the enormous flows going to China, where M&As, by deliberate policy, are practically non-existent.

Moreover, even the part of FDI that is fresh investment may not add much to capital formation, if it crowds out investments that would have been carried out by domestic firms. In a recent paper, Agosin and Machado (2005) performed a series of econometric exercise to determine the extent to which FDI crowded in or out domestic investment in three developing regions (Africa, Asia, and Latin America) over the period 1971-2000, and during each of the three decades of the period. The results suggest that, over the entire period (1971-2000), FDI displaced domestic investment in Latin America. In Africa and Asia, on the other hand, FDI increased overall investment one-to-one. In other words, there was no crowding in or crowding out, and foreign investment added to total investment one-to-one. If the three decades are taken separately, the results show CO in Latin America in the seventies and in Africa in the nineties. So, even in the case where FDI is of the greenfield variety, CI is not assured, because part of that investment could have been undertaken by domestic firms which are pre-empted by multinationals.
Why are multinationals able to pre-empt national firms? Basically because of their superior technology, access to human capital, their ability to penetrate their own domestic markets, or their access to cheap financing. While these advantages are also the main reasons why their presence in host developing countries are sought after assiduously, the authorities of these countries must ask themselves the question of whether domestic firms could have build up some or all of these assets given a reasonable period of time. If the answer is negative, then multinational engagement can be seen in a positive light. However, if the answer is positive, then more selective policies to multinationals do seem in order.
· The global competition for attracting FDI: there is competition between TNCs.
FDI trends over the past decade: increased competition in global markets (see WB, Global Economic Prospects/GEP 2003)
For TNCs: trade-offs regarding the advantage of FDI vs exporting: mode of entry A multinational can export its products, or create of productive capacity via FDI. Disadvantage=FDI is irreversible + risk of creating underutilised capacity in small markets.
There is competition between developing countries: the ‘race to the bottom’ in terms of regulation, tax exemptions, export processing zones: lower barriers to trade and investment competition, privatisation, end of monopolies.
The competition for attracting FDIs has increased with globalisation. Global production networks are now central feature of globalisation. TNCs outsource production of parts and equipment or to otherwise locate production facilities offshore.
Effects?
Typically, for the IFIs: taking advantage of TNCs oblige governments to offer private investment attractive regulations, a favourable ‘business climate’, costly complementary public investments.
See the other lectures, e.g., on privatisation: attracting FDI: argument for improving the ‘business climate’: see the WB-IFC Doing Business annual reports.
The Economist, Oct 4th 2007, on the “Doing Business 2008” report: Congo, where it takes 155 days to get a business up, is the lowest ranked country in the survey.

For the IFIs, the protection of investors property rights increases incentive to invest, stable macroeconomic environments, “good institutions”, liberalising investment flows, enhanced access, competition; curbing policies distorting investment flows and trade.
SSA poor countries: for global investors, not well-placed in term of policies and institutions+ the disadvantage of small markets.
TNCs that ‘deverticalise’ production through outsourcing create new opportunities for suppliers+foundation for a steady increase in trade. But: this production and the associated high rates of export growth are highly concentrated geographically: few countries benefit. (WB GEP 2003)
Mitigated effects: FDI can be opportunities for wages and employment, but less room of manoeuvre for governments in their fiscal welfare and redistributive policies.


No comments:
Post a Comment